Employee Performance Analysis
| ✅ Paper Type: Free Essay | ✅ Subject: Statistics |
| ✅ Wordcount: 2132 words | ✅ Published: 04 Oct 2017 |
Project Outline:
This research is about the Employee performance in an organization. Data related to several factors such as Employee Productivity, Customer Satisfactions Scores, Accuracy Scores, Experience and Age of Employees is taken into consideration. Statistical methods are used to identify if there is any impact of Age and Experience of Employees on factors such as Productivity, Customer Satisfaction and Accuracy.
Theoretical Framework:
XYZ Corporation operating out of Illinois, US want to find out if the age and experience of employees have an impact on his/her performance. They have hired an external consultant to study the impact of these two factors (age and experience) on the performance metrics of the employees. According to the results of the research conducted by this external consultant, XYZ Corporate will design a strategy of recruiting the right talent which will have maximum performance.
Design and Methodology:
Design and Methodology used by the external consultant include identifying the various performance factors common across different businesses within XYZ Corporation. The performance measures common for all businesses included:
- Customer Satisfaction Scores
- Accuracy Scores
- Productivity
The consultants decided to study the impact of age of employees and their experience on the above factors by using statistical methods.
Details on participants and sampling methods:
Sampling Methods:
Sampling is the process of selecting a small number of elements from a larger defined target group of elements. Population is the total group of elements we want to study. Sample is the subgroup of the population we actually study. Sample would mean a group of ‘n’ employees chosen randomly from organization of population ‘N’. Sampling is done in situations like:
- We sample when the process involves destructive testing, e.g. taste tests, car crash tests, etc.
- We sample when there are constraints of time and costs
- We sample when the populations cannot be easily captured
Sampling is NOT done in situations like:
- We cannot sample when the events and products are unique and cannot be replicable
Sampling can be done by using several methods including: Simple random sampling, Stratified random sampling, Systematic sampling and Cluster sampling. These are Probability Sampling Methods. Sampling can also be done using methods such as Convenience sampling, Judgment sampling, Quota sampling and Snowball sampling. These are non-probability methods of sampling.

Simple random sampling is a method of sampling in which every unit has equal chance of being selected. Stratified random sampling is a method of sampling in which stratum/groups are created and then units are picked randomly. Systematic sampling is a method of sampling in which every nth unit is selected from the population. Cluster sampling is a method of sampling in which clusters are sampled every tth time.
For the non-probability methods, Convenience sampling relies upon convenience and access. Judgment sampling relies upon belief that participants fit characteristics. Quota sampling emphasizes representation of specific characteristics. Snowball sampling relies upon respondent referrals of others with like characteristics.
In our research, the consultant organization used a Simple Random Sampling method to conduct the study where they chose about 75 random employees and gathered data of age, experience, their Customer Satisfaction scores, their Accuracy Scores and their Productivity scores.
The employees were bifurcated into 3 age groups, namely, 20 – 30 years, 30 – 40 years and 40 – 50 years. Similarly, they were also bifurcated into 3 experience groups, namely, 0 – 10 years, 10 – 20 years and 20 – 30 years.
Data Analysis:
Below are the different data analysis options used by the consultant:
- Impact of Age on Accuracy
- Impact of Experience on Accuracy
- Impact of Age on Customer Satisfaction
- Impact of Experience on Customer Satisfaction
- Impact of Age on Productivity
- Impact of Experience on Productivity
For each of the above statistical analysis, we will need to use Hypothesis testing methods. Hypothesis testing tells us whether there exists statistically significant difference between the data sets for us to consider to represent different distribution. The difference that can be detected using hypothesis testing is:
- Continuous Data
- Difference in Average
- Difference in Variation
- Discrete Data
- Difference in Proportion Defective
We follow the below steps for Hypothesis testing:
- Step 1 : Determine appropriate Hypothesis test
- Step 2 : State the Null Hypothesis Ho and Alternate Hypothesis Ha
- Step 3 : Calculate Test Statistics / P-value against table value of test statistic
- Step 4 : Interpret results – Accept or reject Ho
The mechanism of Hypothesis testing involves the following:
- Ho = Null Hypothesis – There is No statistically significant difference between the two groups
- Ha = Alternate Hypothesis – There is statistically significant difference between the two groups
We also have different types of errors that can be caused if we are using hypothesis testing. The errors are as noted below:
- Type I Error – P (Reject Ho when Ho is true) = α
- Type II Error – P (Accept Ho when Ho is false) = β
P Value – Statistical Measure which indicates the probability of making an α error. The value ranges between 0 and 1. We normally work with 5% alpha risk, a p value lower than 0.05 means that we reject the Null hypothesis and accept alternate hypothesis.
Let’s talk a little about p-value. It is a Statistical Measure which indicates the probability of making an α error. The value ranges between 0 and 1. We normally work with 5% alpha risk. α should be specified before the hypothesis test is conducted. If the p-value is > 0.05, then Ho is true and there is no difference in the groups (Accept Ho). If the p-value is < 0.05, then Ho is false and there is a statistically significant difference in the groups (Reject Ho).
We will also discuss about the types of hypothesis testing:
- 1-Sample t-test: It’s used when we have Normal Continuous Y and Discrete X. It is used for comparing a population mean against a given standard. For example: Is the mean Turn Around Time of thread ï‚£15 minutes.
- 2-Sample t-test: It’s used when we have Normal Continuous Y and Discrete X. It is used for comparing means of two different populations. For example: Is the mean performance of morning shift = mean performance of night shift.
- ANOVA: It’s used when we have Normal Continuous Y and Discrete X. It is used for comparing the means of more than two populations. For example: Is the mean performance of staff A = mean performance of staff B = mean performance of staff C.
- Homogeneity Of Variance: It’s used when we have Normal Continuous Y and Discrete X. It is used for comparing the variance of two or more than two populations. For example: Is the variation of staff A = variation of staff B = variation of staff C.
- Mood’s Median Test: It’s used when we have Non-normal Continuous Y and Discrete X. It is used for Comparing the medians of two or more than two populations. For example: Is the median of staff A = median of staff B = median of staff C.
- Simple Linear Regression: It’s used when we have Continuous Y and Continuous X. It is used to see how output (Y) changes as the input (X) changes. For example: If we need to find out how staff A’s accuracy is related to his number of years spent in the process.
- Chi-square Test of Independence: It’s used when we have Discrete Y and Discrete X. It is used to see how output counts (Y) from two or more sub-groups (X) differ. For example: If we want to find out whether defects from morning shift are significantly different from defects in the evening shift.
Let’s look at each of the analysis for our research:
Impact of Age on Accuracy
|
Practical Problem |
Hypothesis |
Statistical Tool Used |
Conclusion |
|
Is Accuracy impacted by Age of Employees |
H0: Accuracy is independent of the Age of Employees H1: Accuracy is impacted by Age of Employees |
One-Way ANOVA |
p-value < 0.05 indicates that performance measure of accuracy is impacted by age factor |

One-way ANOVA: Accuracy versus Age Bucket
Source DF SS MS F P
Age Bucket 2 0.50616 0.25308 67.62 0.000
Error 72 0.26946 0.00374
Total 74 0.77562
S = 0.06118 R-Sq = 65.26% R-Sq(adj) = 64.29%
Individual 95% CIs For Mean Based on
Pooled StDev
Level N Mean StDev ——+———+———+———+—
20 – 30 years 26 0.75448 0.06376 (—*–)
30 – 40 years 26 0.85078 0.07069 (—*–)
40 – 50 years 23 0.95813 0.04416 (—*—)
——+———+———+———+—
0.770 0.840 0.910 0.980
Pooled StDev = 0.06118
Boxplot of Accuracy by Age Bucket
Conclusion: P-value of the above analysis < 0.05 which indicates that we reject the null hypothesis and thus, the performance measure of accuracy is impacted by age of employees. As the age increases, we observe that the accuracy of the employees also increases.
Impact of Experience on Accuracy
|
Practical Problem |
Hypothesis |
Statistical Tool Used |
Conclusion |
|
Is Accuracy impacted by Experience of Employees |
H0: Accuracy is independent of the Experience of Employees H1: Accuracy is impacted by Experience of Employees |
One-Way ANOVA |
p-value < 0.05 indicates that performance measure of accuracy is impacted by experience factor |

One-way ANOVA: Accuracy versus Experience Bucket
Source DF SS MS F P
Experience Bucke 2 0.53371 0.26685 79.42 0.000
Error 72 0.24191 0.00336
Total 74 0.77562
S = 0.05796 R-Sq = 68.81% R-Sq(adj) = 67.94%
Individual 95% CIs For Mean Based on
Pooled StDev
Level N Mean StDev ——-+———+———+———+–
0 – 10 years 24 0.74403 0.05069 (–*—)
10 – 20 years 23 0.84357 0.05354 (—*–)
20 – 30 years 28 0.94696 0.06660 (–*–)
——-+———+———+———+–
0.770 0.840 0.910 0.980
Pooled StDev = 0.05796
Boxplot of Accuracy by Experience Bucket
Conclusion: P-value of the above analysis < 0.05 which indicates that we reject the null hypothesis and thus, the performance measure of accuracy is impacted by experience of employees. As the experience increases, we observe that the accuracy of the employees also increases.
Impact of Age on Customer Satisfaction
|
Practical Problem |
Hypothesis |
Statistical Tool Used |
Conclusion |
|
Is Customer Satisfaction Score impacted by Age of Employees |
H0: Customer Satisfaction Score is independent of the Age of Employees H1: Customer Satisfaction Score is impacted by Age of Employees |
One-Way ANOVA |
p-value < 0.05 indicates that performance measure of Customer Satisfaction score is impacted by age factor |

One-way ANOVA: Customer Satisfaction versus Age Bucket
Source DF SS MS F P
Age Bucket 2 49.51 24.75 18.92 0.000
Error 72 94.23 1.31
Total 74 143.74
S = 1.144 R-Sq = 34.44% R-Sq(adj) = 32.62%
Individual 95% CIs For Mean Based on
Pooled StDev
Level N Mean StDev ———+———+———+———+
20 – 30 years 26 6.906 1.164 (—-*—–)
30 – 40 years 26 8.041 1.156 (—–*—-)
40 – 50 years 23 8.907 1.107 (—–*—–)
———+———+———+———+
7.20 8.00 8.80 9.60
Pooled StDev = 1.144
Boxplot of Customer Satisfaction by Age Bucket
Conclusion: P-value of the above analysis < 0.05 which indicates that we reject the null hypothesis and thus, the performance measure of Customer Satisfaction Score is impacted by age of employees. As the age increases, we observe that the Customer Satisfaction Score of the employees also increases.
Impact of Experience on Customer Satisfaction
|
Practical Problem |
Hypothesis |
Statistical Tool Used |
Conclusion |
|
Is Customer Satisfaction Score impacted by Experience of Employees |
H0: Customer Satisfaction Score is independent of the Experience of Employees H1: Customer Satisfaction Score is impacted by Experience of Employees |
One-Way ANOVA |
p-value < 0.05 indicates that performance measure of Customer Satisfaction score is impacted by experience factor |

One-way ANOVA: Customer Satisfaction versus Experience Bucket
Source DF SS MS F P
Experience Bucke 2 51.20 25.60 19.92 0.000
Error 72 92.54 1.29
Total 74 143.74
S = 1.134 R-Sq = 35.62% R-Sq(adj) = 33.83%
Individual 95% CIs For Mean Based on
Pooled StDev
Level N Mean StDev ——–+———+———+———+-
0 – 10 years 24 7.035 1.277 (—–*—–)
10 – 20 years 23 7.570 0.922 (—–*—–)
20 – 30 years 28 8.948 1.160 (—-*—-)
——–+———+———+———+-
7.20 8.00 8.80 9.60
Pooled StDev = 1.134
Boxplot of Customer Satisfaction by Experience Bucket
Conclusion: P-value of the above analysis < 0.05 which indicates that we reject the null hypothesis and thus, the performance measure of Customer Satisfaction Score is impacted by experience of employees. As the experience increases, we observe that the Customer Satisfaction Score of the employees also increases.
Impact of Age on Productivity
|
Practical Problem |
Hypothesis |
Statistical Tool Used |
Conclusion |
|
Is Productivity impacted by Age of Employees |
H0: Productivity is independent of the Age of Employees H1: Productivity is impacted by Age of Employees |
One-Way ANOVA |
p-value < 0.05 indicates that performance measure of Productivity is impacted by experience factor |
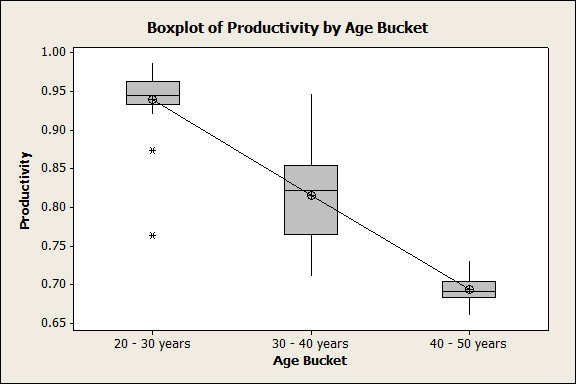
One-way ANOVA: Productivity versus Age Bucket
Source DF SS MS F P
Age Bucket 2 0.74389 0.37194 194.56 0.000
Error 72 0.13765 0.00191
Total 74 0.88153
S = 0.04372 R-Sq = 84.39% R-Sq(adj) = 83.95%
Individual 95% CIs For Mean Based on
Pooled StDev
Level N Mean StDev ——+———+———+———+—
20 – 30 years 26 0.93959 0.04287 (-*–)
30 – 40 years 26 0.81511 0.05831 (-*-)
40 – 50 years 23 0.69291 0.01747 (–*-)
——+———+———+———+—
0.720 0.800 0.880 0.960
Pooled StDev = 0.04372
Boxplot of Productivity by Age Bucket
Conclusion: P-value of the above analysis < 0.05 which indicates that we reject the null hypothesis and thus, the performance measure of Productivity is impacted by age of employees. As the age increases, we observe that the Productivity of the employees decreases.
Impact of Experience on Productivity
|
Practical Problem |
Hypothesis |
Statistical Tool Used |
Conclusion |
|
Is Productivity impacted by Experience of Employees |
H0: Productivity is independent of the Experience of Employees H1: Productivity is impacted by Experience of Employees |
One-Way ANOVA |
p-value < 0.05 indicates that performance measure of Productivity is impacted by experience factor |

One-way ANOVA: Productivity versus Experience Bucket
Source DF SS MS F P
Experience Bucke 2 0.74024 0.37012 188.61 0.000
Error 72 0.14129 0.00196
Total 74 0.88153
S = 0.04430 R-Sq = 83.97% R-Sq(adj) = 83.53%
Individual 95% CIs For Mean Based on
Pooled StDev
Level N Mean StDev –+———+———+———+——-
0 – 10 years 24 0.94474 0.03139 (–*–)
10 – 20 years 23 0.83120 0.05754 (–*-)
20 – 30 years 28 0.70599 0.04118 (–*-)
–+———+———+———+——-
0.700 0.770 0.840 0.910
Pooled StDev = 0.04430
Boxplot of Productivity by Experience Bucket
Conclusion: P-value of the above analysis < 0.05 which indicates that we reject the null hypothesis and thus, the performance measure of Productivity is impacted by experience of employees. As the experience increases, we observe that the Productivity of the employees decreases.
Conclusion of the Analysis:
- As Age and Experience increases, the Accuracy and Customer Satisfaction Scores of Employees increases
- As Age and Experience increases, the Productivity of Employees decreases
Bibliography:
The data used in this analysis is self-created data using statistical software.
Research Schedule (Gantt Chart) of the Project:

Cite This Work
To export a reference to this article please select a referencing stye below:
Related Services
View all


DMCA / Removal Request
If you are the original writer of this essay and no longer wish to have your work published on UKEssays.com then please click the following link to email our support team:
Request essay removal