Atomic Short Range Order (SRO) in Ni20Pd80 Alloy
| ✅ Paper Type: Free Essay | ✅ Subject: Physics |
| ✅ Wordcount: 512 words | ✅ Published: 09 Mar 2018 |
An Experimental and Theoretical Study of the Atomic Short Range Order (SRO) in Ni20Pd80 Alloy
Abstract
The behavior of atomic short range order (SRO) has been investigated in a polycrystalline alloy of Ni20Pd80 at different temperatures by using diffuse X-ray scattering intensities. The ordering energies and the atomic SRO-parameters (α1) have been calculated by using the electronic theory of ordering in the pseudopotential approximation and compare with the experimental results. The intensity distribution pattern of Ni20Pd80 obtained through XRD depicts a deviation from random structure at all annealing temperatures. We make an analysis using the prior obtain X-ray intensities of Ni20Pd80 and calculate the atomic short range order-function (SROF) g(r) as a function of annealing temperatures. Some of the values of α1 calculated by using SROF and appears as negative, indicating the existence of SRO in Ni20Pd80 alloy. We have obtained the parameter for second and third nearest neighbors, which turns out to be positive. Electronic theory of alloys in the pseudopotential approximation was employed to calculate the ordering energies and the values of α1. It was found that this theory predicts the same sign of α1 for selected alloy as observed from the experiments. The results can be further improved by considering the order of perturbation and the atomic size effect for the studied alloy.
Keywords: Ni20Pd80 alloy; short range order (SRO); X-ray diffraction (XRD); transition metal model pseudopotential (TMMP); short range order-function (SROF); SRO-parameter (α1)
Introduction
X-ray scattering intensity measurement of alloys reveals in the information about degree of atomic SRO and has been immensely used by many authors to establish the presence of ordering in various binary and multi-component alloys [1]. The presence of the atomic SRO in the disordered solid solutions influences the physical properties of the alloys significantly and a recent study of the electronic theory of alloys based on the pseudo-potential approximation has appeared successfully to predict the ordering in transition metal alloys [2-4]. Lin et al. have shown the formation of clusters in the samples with Pd concentration of 25-75 at.% [5]. Our study shows that beyond 75 at.% Pd, Ni-Pd alloy has a tendency to form SRO.
In this paper, we have carried out the calculation of temperatures in binary Ni20Pd80 alloy by combining the method of pseudopotential approximation. Therefore, it encourages investigating the atomic SRO in the Ni20Pd80 alloy. Not only, we establish SRO in Ni20Pd80 and also compare the theoretical results with the experiment.
Experimental Technique
For experimental work XRD technique was employed. The round-shaped master ingot (~10 g) of polycrystalline Ni20Pd80 alloy was gratefully supplied by Degussa (Germany). These pellets were cut into two halves, surface-ground and polished to produce a mirror surface suitable for XRD study. Chemical analysis carried out by electron probe micro-analyzer gave nearly the starting compositions. Ni20Pd80 alloy was annealed at each given temperature for 5 hrs in a vacuum better than 10-5 mbar and quenched. The X-ray experiments were performed on a Shimadzu XD-5A diffractometer in the reflection mode, using line-focused Cu-Kα radiation. The intensity measurements were carried out in the angle range 40ï‚°<2ï±<140°ï€ with a step of 0.2 and all measurements were made in the fixed time mode with counting time of 100 sec per angle. All of the measurements were made at room temperature of 25±0.5°C respectively.

Theoretical Calculations
The electronic theory of alloys gives the following expression for the ordering energy of binary AB alloy [10] as below:
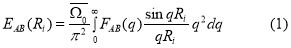
Where,  is the average atomic volume of the alloy and Ri is the radius of ith coordination sphere in the particular crystal structure. The factor FAB(q) represents the energy-wave number characteristics of the alloy [10].
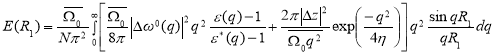 The electronic theory of alloys in 2nd order perturbation theory gives the ordering energy of a binary alloy corresponding to the ith coordination sphere is given by [6].
 Where,
  = ï-/N is the volume per atom, N is the number of atoms in the crystal of volume ï-,
  is the difference of the unscreened pseudopotential form factors of the alloy constituents [7],
  and
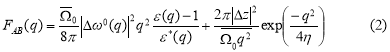
and  are the dielectric and modified screening factors which include the effect of exchange and correlation [8] and η is the Ewald’s parameter. FAB(q) is the energy wavenumber characteristic which is the local pseudopotential approximation may be expressed as [10]:
The first term in Eq. (2) gives the contribution of the band structure and this second term is of the electro static energy.
In 3rd order perturbation theory, the ordering energy is given by [9, 10]:
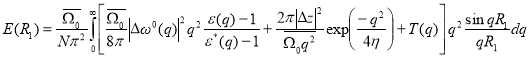
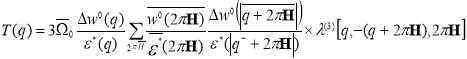 Here,
Here,
The term T(q) is the effective pair corrections to the ordering potential. This correction arises in the 3rd order perturbation theory due to double scattering process of conduction electrons from the ion pairs. The term responsible for the effects connected with the presence of three body interaction are not taken into consideration.
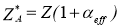
In disordered binary solid solutions, if two different atoms A and B have size difference they exhibit static displacements from exact lattice positions. For close neighbors, there can be three different distances depending on whether it is an AA-, BB- or AB-pairs. In case of two atoms, that is no close neighbor and the variation in distance results from the variations in the composition of the region between them. The variation in close neighbor distances attributes to the kind of atoms making up the pair [10]. The ordering potential is modified by incorporating the atomic size effect and is given by:
E(R1) =A(R1)−B(R1)
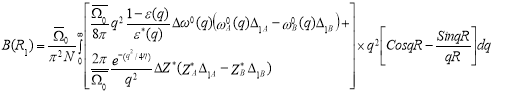 Where, A(R1) and B(R1) are the first nearest neighbor distances of A- and B-atom. Here, the factor B(R1) is given by:
And
B(R1) =B1A∆1A+B1B∆1B
Here,

The expression for B1B can be written in a similar manner.
Where,

And

Where,

Here,
 ,
, 
Clapp-Moss relation was used to determine the value of SRO-parameter. The values of α1 were determined from the ordering energy by using the Clapp-Moss expression [11]:
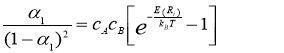
Where kB is the Boltzmann constant.
In this work, we have also investigated the effect of the exchange and correlation factors on the ordering energies. The expressions to account for the exchange and correlation correction effect f(q) proposed by Kleinmen [12], Singwi [13], Hubbard-Sham [14], SLTS [13] and Lindhard [15] are given below:
Kleinman: 

Singwi: 
A=0.8894
B=0.3401
Hubbard-Sham: 
SLTS: 
Lindhard: f (q) =0
Results and Discussion
Fig. 1 shows the XRD pattern recorded at room temperature obtained for the annealed sample of Ni20Pd80 at various temperatures. The splitting of high angle Bragg reflection for CuKα1 and Cu-Kα2 radiations demonstrates the quality of the sample. The patterns were indexed following the procedure mentioned in Ref. 16. Since, all the fundamental reflections (hkl all even or all odd) were present; the patterns were therefore indexed as Face Centered Cubic (FCC). The sample was single phase and has FCC of A1-type structure with lattice parameter a=0.382 nm [17].
The lattice parameters were calculated from XRD patterns taken after annealing the Ni20Pd80 alloy at various annealing temperature by the extrapolation of the Nelson-Riley function and their values are plotted in Fig. 2. It can be clearly seen that the value of lattice parameter ‘a’ increases linearly with temperature. The reason for this increase in ‘a’ is the thermal expansion in lattice due to increase of temperature. Fig. 3 shows the plot of SRO-function g(r) corresponding to temperatures i.e., 100, 300 and 600 °C. The SRO-function g(r) was determined from the measured intensities using the following relation [18]:

Where, r is the radial distance, and Q is the reciprocal lattice vector

Where, Ieu(SRO) is the observed intensity free from parasitic contributions and is measured in electron units. The procedures for the removal of parasitic contributions and the method to convert the measured intensities into electron units are outlined in Ref. 19. The radii of the coordination spheres were calculated from the lattice parameters determined from the XRD pattern.
The function g(r) was determined from the intensities measured for each annealing temperature. It is clear from Fig. 3 that the variations in the g(r) with respect to temperature are subjected to the changes in SRO inside an alloy. The first peak in the plot of g(r) is not relevant to the structure but comes from the modification function used in the calculation in order to take into account the infinite limit of the integral in the expression of g(r). This feature is more prominent in the curve corresponding to 100 °C as compared to the other two curves.
The SRO-parameters were determined from the data shown in Fig. 1 using the following expression [18]:

Where ci is the coordination number and αi is the radius and α1 for the ith coordination sphere. There values are listed in Table 1 for the first, second and third nearest neighboring spheres. The value of α1 was observed to be negative for all annealing temperatures. The variations in its value are due to the variation in the degree of SRO taking place with a change of temperature. The values of α2 and α3 were found to be positive for all investigated temperatures which indicate the formation of clusters in the second and third nearest neighboring spheres.
The parameters of TMMP [7] and the lattice parameters determined using the Vegard’s rule was used as input for these calculations. The results of these calculations are listed in Table 2. It is seen that the values of α1 is negative corresponding to different exchange and correlation factors. The values of α1 were found to be negative from the XRD experiments too. It is therefore concluded that the electronic theory of alloys (2nd order perturbation) yields a good agreement between the experiment and theory as far as sign of the α1 is concerned. The values of α1 calculated employing the 3rd order perturbation correction and by taking into account the difference in atomic size of Ni20Pd80 are also given in Table 2. The difference in the magnitude of experimental and theoretical values may be attributed to the following reasons, (i) these calculations apply only to the ground state 100 °C where as the experiments have been done at higher temperatures. (ii) The values of lattice parameters used in these calculations were calculated from Vegard’s rule.
Conclusions
XRD experiments were performed on the Ni20Pd80 alloy to study SRO. In order to compare the experimental results with the theory, calculation of ordering energies was undertaken using the electronic theory of alloys in the pseudo-potential approximation. The analysis of the experimental data yields information regarding the SRO. The structure of the alloy is FCC over a temperature range of 100-600 °C. The lattice parameter of the alloy increases with temperature as expected by theory. The experimental values of α1 were found to be negative at all investigated temperatures, which indicates formation of SRO in this alloy. The experimental values of ï¡2 and ï¡3 were found to be positive, which indicates formation of clusters in the second and third neighboring spheres, if order of perturbation and size-effect is taken into account in these calculations.
Acknowledgements
The author S. K. Ajmal would like to thank — and —– are acknowledged for their helpful discussions.
References
[1] V.I. Iveronova, A.A. Katsnelson, Short Range Order in Metallic Solid Solutions (in Russian), Moscow University Press, (1977).
[2] W. Pfeiler, Acta Metall. 36 (1988) 2417.
[3] T. Abbas, R.M.A. Khalil, A.M. Rana, Mahtabullah, Mod. Phys. Lett. B 20 (2006) 2425.
[4] S. Akhtar, A.B. Ziya, T. Abbas, Physica B 404 (2009) 2241-2243.
[5] W. Lin, J.E. Spruiell, Acta Metall. 19 (1971) 451.
[6] F.A. Khawaja, A.A. Katsnelson, V.M. Silonov, Phys. Stat. Sol. 88 (1978) 477.
[7] A.O.E. Animalu, Phys. Rev. B 8 (1973) 3542-3554.
[8] P.A. Rossiter, The Electrical Resistivity of Metals and Alloys, University Press, Cambridge, (1987).
[9] F.A. Khawaja, A.A. Katsnelson, V.M. Silonov, M.M. Khrushchov, Phys. Stat. Sol. 82 (1977) 701.
[10] A.A. Katsnelson, V.M. Silonov, F.A. Khawaja, Phys. Stat. Sol. 91 (1979) 11.
[11] P.C. Clapp, S.C. Moss, Phys. Rev. 171 (1968) 754.
[12] L. Kleinman, Phys. Rev. 160 (1967).
[13] K.S. Singwi, M.P. Tosi, A. Sjolander, R.H. Land, Phys. Rev. 176 (1968) 589.
[14] J. Hubbard, L.J. Sham, Proc. Roy. Soc. (London), A240 (1957) 359.
[15] Lindhard, D. Langreth, Phys. Rev. 181 (1969) 753.
[16] B.D. Cullity, Elements of X-ray Diffraction, Addison Wesley, Philippines (1978).
[17] S. Ahmad, A.B. Ziya, A. Aziz, Z. I. Zafar, J. Mater. Sci. Technol. 25 (2009) 208-210.
[18] B.E. Warren, X-ray Diffraction, Dover, New York, (1990).
[19] T. Abbas, A.B. Ziya, J. Mat. Sc. 28 (1993) 5010.
Figure captions
Fig. 1 XRD pattern of Ni20Pd80 alloy taken at 100-600 °C after annealing temperature.
Fig. 2 Temperature dependence of lattice parameter a(Ǻ) of Ni20Pd80 alloy determined from the Nilson-Riley function.
Fig. 3 Temperature dependence of atomic short range order function g(r).
Table captions
Table 1:
The SRO-parameters for various shells of atoms obtained from experimental diffuse scattering intensities of X-rays for Ni20Pd80 alloy.
Table 2:
The ordering energies for Ni20Pd80 alloy calculated using the electronic theory of alloy in the pseudo-potential approximation.
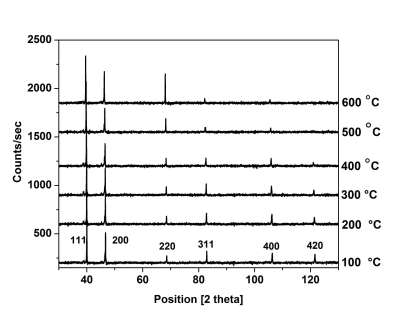 Figure 1
Figure 2
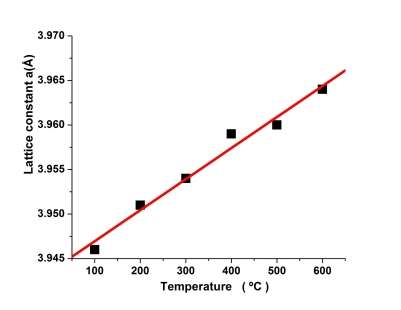
Figure 3
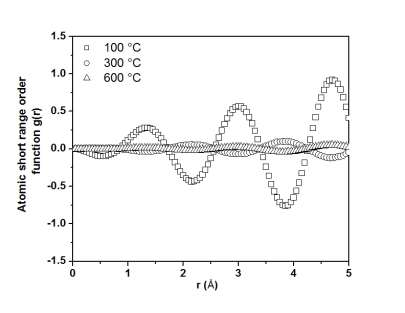
Table 1
|
Temperature (oC) |
Coordination no. i |
ci |
αi |
|
100 |
1 |
12 |
-0.12 |
|
2 |
6 |
0.32 |
|
|
3 |
24 |
0.05 |
|
|
300 |
1 |
12 |
-0.14 |
|
2 |
6 |
0.37 |
|
|
3 |
24 |
0.07 |
|
|
600 |
1 |
12 |
-0.06 |
|
2 |
6 |
0.18 |
|
|
3 |
24 |
0.02 |
Table 2
|
E(Ri) (eV) (10-2) |
α1 |
Order of Perturbation |
Exchange & Correlation Factor f(q) |
||
|
Coordination no. i |
|||||
|
1 |
2 |
3 |
|||
|
1.591 |
0.433 |
-0.162 |
-0.150 |
II |
Kleinman |
|
1.559 |
0.424 |
-0.158 |
-0.148 |
Singwi et.al. |
|
|
1.504 |
0.423 |
-0.158 |
-0.144 |
Hubbard-Sham |
|
|
1.448 |
0.420 |
-0.156 |
-0.140 |
SLTS |
|
|
1.453 |
0.423 |
-0.157 |
-0.141 |
Lindhard |
|
|
1.588 |
0.434 |
-0.163 |
-0.150 |
III |
Kleinman |
|
1.557 |
0.424 |
-0.159 |
-0.148 |
Singwi et.al. |
|
|
1.502 |
0.423 |
-0.158 |
-0.144 |
Hubbard-Sham |
|
|
1.566 |
0.433 |
-0.162 |
-0.148 |
SLTS |
|
|
1.451 |
0.423 |
-0.158 |
-0.141 |
Lindhard |
|
|
2.107 |
0.028 |
0.081 |
-0.179 |
II with size effect |
Kleinman |
|
2.065 |
0.027 |
0.081 |
-0.177 |
Singwi et.al. |
|
|
2.009 |
0.039 |
0.073 |
-0.174 |
Hubbard-Sham |
|
|
1.948 |
0.050 |
0.065 |
-0.171 |
SLTS |
|
|
1.956 |
0.051 |
0.065 |
-0.171 |
Lindhard |
Cite This Work
To export a reference to this article please select a referencing stye below:
Related Services
View all


DMCA / Removal Request
If you are the original writer of this essay and no longer wish to have your work published on UKEssays.com then please click the following link to email our support team:
Request essay removal