Infrared Thermography System Requirements
| ✅ Paper Type: Free Essay | ✅ Subject: Engineering |
| ✅ Wordcount: 2293 words | ✅ Published: 31 Aug 2017 |
As the use of advanced materials continues to increase in the aerospace community, the need for a quantitative, rapid, in situ inspection technology has become a critical concern throughout the industry. In many applications it is necessary to monitor changes in these materials over an extended period of time to determine the effects of various loading conditions. Additionally, the detection and characterization of defects such as delaminations, cracking, corrosion, etc, is of great concern.
1.1 Thermographic inspection of materials
Thermography is particularly adapted for non-destructive testing and can be used on different materials:
- carbon-epoxy,
- lightweight metallic alloys,
- thin metal skin on honeycomb structure (like aircraft doors),
- epoxy resin with glass fibre reinforcement GFRP, and
- panel skins with CFRP (Carbon Fibre Reinforced Plastic) like helicopter blades.
The control contributes to highlight the most prominent types of discontinuities seen in aerospace materials including:
- porosity, which reduces the compressive load carrying capability,
- water ingress or moisture which can degrade the mechanical properties of some resins or lead to freeze inside the part causing more and more damage,
- disbond or delamination or cracking resulting from low strength or failure,
- impact damage during the taxi or caused by bird strike or by a dropped tool during maintenance, and
- inclusions which can reduce strength by kinking the fibres around the inserted material.
Thermographic methods are those in which the presence of flaws is determined by monitoring the flow of heat over the surface of a structure after some external introduction of a temperature gradient. The presence of flaws disrupts the normal pattern of heat flow that would be expected in a sound structure. The method is more sensitive to flaws near to the surface. Modern thermographic systems commonly use infrared (IR) cameras to detect radiated heat and are controlled by TV video electronics which sample the field of view at a typical rate of 50Hz, allowing temperature variations on a 20ms time-scale to be resolved. The camera is sensitive to temperature changes of about 0.005°C and covers a chosen range of temperature, 4°C and 8°C being commonly suitable, although operation is possible between -50°C and +100°C. Liquid crystal coatings and pyroelectric detectors have also been used [3.1] to detect IR radiation.
Infrared thermography has proved to be an effective tool in the inspection of materials. By providing either a single-sided or a two-sided inspection, the presence and growth of defects in aerospace structures can be evaluated and used to estimate the remaining life of these materials. Thermography can be performed using a variety of heat sources including flash heating (short pulse), step heating (long pulse) and spatially shaped heat sources, thus providing an inspection tool that is applicable to a wide range of material properties, thicknesses and defect types.
The principle of infrared thermography (IRT) for non-destructive inspection (NDI) consists in highlighting the relevant differences or gradient disturbances of temperature due to imperfections and deteriorations of the inspected structures. They become visible on the surfaces of these objects. The domain of infrared thermography is quite recent and covers vast fields of applications. In the industrial context, infrared thermography is used either by the passive approach (by simple observation of the isotherms on the surface of interest) or by the active approach (by stimulating the thermal response of the specimen).
Thermography has many advantages over more traditional inspection methods. For example, ultrasonic (UT) inspection methods typically require the use of a coupling medium (either water or some other fluid), which can present difficulties for some materials and can make in situ inspection significantly more complicated. Further, UT inspections consist of scanning a small diameter transducer over the surface of the structure; this requires expensive, automated scanning equipment and can be quite time consuming. Thermography, on the other hand, can rapidly image large areas of the structure with little or no surface preparation. As it is mentioned in [3.2], in a typical inspection it is possible to image a 1m2 area in approximately 20 seconds.
1.2 Thermography sensors specifications
The IR or infrared portion occupies roughly the region between 10 to the minus 4 to 10 to the minus 3 centimetres, or, from about 1 micron to about 100 microns. But most commercial equipment comes designed to operate in portions of the region, for a number of reasons (lower atmospheric absorption of IR radiation -or IR “atmospheric windows”, detector availability at reasonable cost). Commercial IR thermography equipment comes in in the following wavelength bands and their filtered sub-bands. Common jargon follows approximately the terminology listed below [3.3]:

- the near IR region and band is from about 0.7 to 1.7 microns,
- the short wave or SW band is from about 1.8 to 2.4 microns,
- the medium wave or MW band is from about 2.4 to 5 microns, and the
- long wave or LW band is from about 8 to 14 microns.
Depending on the selected wavelength, there are a number of performance requirements that must be properly defined to ensure high-quality inspection results. An overview of them is given in the following whereas a more detailed definition will follow in the next subsections of the deliverable.
- An infrared detector response greater than 5 microns and less than 15 microns with the spectral bandwidth encompassing the 8-10 micron region.
- Accurate data repeatability in temperature value and location.
- A direct linear correspondence between the distance travelled, anatomic location and the displayed temperature values.
- Controlled infrared beam collimation to prevent sensor cross-talk.
- A sufficient number of infrared samples must be taken in order to maintain an adequately detailed graph resolution. The number of samples taken should be equivalent to the minimum standards of acceptable camera systems.
- Repeatability and precision of 0.1°C detection of temperature difference.
- Accuracy of +/- 2% or less.
- Ability to perform accurate quantitative differential temperature analysis.
- High-resolution image display for interpretation.
- Ability to archive images for future reference and image comparison.
- Software manipulation of the images should be maintained within strict parameters to insure that the diagnostic qualities of the images are not compromised.
Having decided that a thermographic (infrared) inspection will provide the kind of information which will satisfy an inspection need, the next decision is to select a thermographic sensor. The technical specifications are lengthy and full of abbreviations and jargon. A full comprehension of the meanings and implications of the specifications is essential to making a correct equipment selection. The following information regarding the critical parameters in thermography inspection tasks has been taken from [3.4].
- Operating Band,
- emissivity Correction,
- instantaneous Field of View (Spatial Resolution),
- measurement of Field of View,
- spot Size Ratio,
- noise Equivalent Temperature Difference,
- minimum Detectable Temperature,
- thermal Resolution,
- accuracy,
- zoom (optical and digital),
- lenses and Filters,
- frame Rate,
- field display, and
- non-uniformity Correction.
The consortium has decided to avoid thermographic sensors with cooled detector types whose their cost can exceed 100,000 € per sensor. In case the performance of the uncooled thermo- cameras is not satisfying, the consortium will decide for the possible use of cooled thermography sensors. The technical specifications of the thermography sensors for the three wavelengths considered are analytically given in the following Table 3.1.
Table 3.1: Technical specifications of the three operating bands in IR systems
|
NIR |
MidWaveIR |
LongWaveIR |
|
|
Detector type |
Uncooled microbolometer |
||
|
Image format |
≥ 80 x 80 pixel |
||
|
Pixel pitch |
< 35µm |
||
|
Spectral range |
0.9 µm … 1.7 µm |
3.5 µm … 5 µm |
8 µm …. 13 µm |
|
Range for measuring/ visualization |
-20 °C … +80°C |
||
|
Temperature resolution |
NETD < 100mK | with filtering NETD < 50mK |
||
|
Measurement accuracy |
± 2 K (0 °C … 100 °C) |
||
|
Dynamicrange |
16 bit |
||
|
Imagerate |
> 30 frames per second |
||
|
Field of view |
> 15° x 15° |
||
|
Interfaces |
USB or Giga-Ethernet or CameraLink or IEEE-1394 (FireWire) or S-/-C-Video or RS-232 OR VGA or WLAN |
||
|
Power supply |
12VDC …. 24VDC |
||
|
Operating temperature |
-15 °C …. +45 °C |
||
|
Storing temperature |
-25 °C … +50 °C |
||
|
Humidity |
Relative humidity 10% … 95%, non-condensing |
||
|
Shock |
Operational : 25 G, IEC 68-2-29 |
||
|
Vibration |
Operational : 2 G, IEC 68-2-6 |
||
|
Weight |
< 10 Kg |
||
|
Options |
Radiometric calibration -40 °C ….. + 300 °C |
||
|
High temperature calibration up to 1,200 °C |
|||
|
Image processing functionalities |
|||
|
Image capturing software |
|||
1.3 Active thermographic techniques and excitation sources
Active infrared thermography [3.5] is a non-destructive testing and evaluation (NDT&E) technique requiring an external source of energy to induce a temperature difference between defective and non-defective areas in the specimen under examination. A wide variety of energy sources are available, the most common types can be divided into optical, mechanical or inductive, although many other sources can be employed. Figure 3.1 shows typical examples of heat sources of these three excitation types.
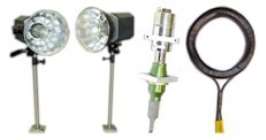
Figure 3.1 Heat sources/excitations examples: (a) optical: flashes (b) mechanical: ultrasonic transducer (c) inductive: electromagnetic coil
1.3.1 Proposed experimental setups for the thermographic techniques
Regardless of the excitation mode being used, three thermographic techniques (pulsed, step and lock-in) will be employed. The experimental setup, along with some theoretical aspects, is given in the following.
Pulsedthermography:Pulsed thermography (PT) is one of the most popular thermal stimulation methods in active thermography. One reason for this is the quickness of the inspection relying on a short thermal stimulation pulse, with duration going from a few milliseconds for high conductivity material inspection (such as metal) to a few seconds for low conductivity specimens (such as plastics).
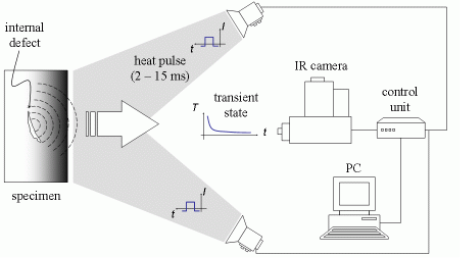
Figure 3.2: The proposed experimental set-up using pulsed thermography in reflection with optical excitation.
Brief heating will be employed here where both the heating phase (while the pulse is applied) and the cooling phase will be observed. There is no interest in observing the thermal changes during the excitation since these images are often saturated. More importantly, this early data does not contain any information about the internal defects yet. In pulsed thermography, the stimulus will be applied with a xenon flash lamp for a flash pulse and alternatively with a halogen lamp in the transient case. Solving the Heat Conduction Equation tells us that the thermal propagation time to the depth of 2 mm to a subsurface defect is about 40 ms in aluminium and for 2 mm of graphite epoxy is about 30s. This means halogen lamps will be preferred here since flash is better for materials of high thermal diffusivity, e.g., metals. Materials with a low thermal diffusivity, e.g., composites, have a long thermal propagation time, which limits flash thermography to the detection of shallow defects.
Stepheatingthermography:Step heating will be also investigated using a larger pulse (from several seconds to a few minutes). The temperature decay is of interest; in this case, the increase of surface temperature will be monitored during the application of a step heating pulse. Variations of surface temperature with time are related to specimen features as in PT. This technique is sometimes referred to as time-resolved infrared radiometry (TRIR).
Lock-inthermography: Lock-in thermography (LT) will be also employed, (known as modulated thermography), where the specimen is stimulated with a periodic energy source, Figure 3.3. Sinusoidal waves of different frequencies will be used, although it is possible to use other periodic waveforms as well. Internal defects, acting as barriers for heat propagation, are expected to produce changes in amplitude and phase delay of the response signal at the surface that will permit the detection of defects in higher depths (>3mm).
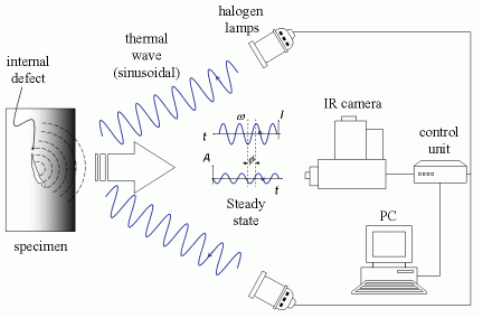
Figure 3.3: The proposed experimental set-up for lock-in thermography in reflection with optical excitation
1.3.2 Types of excitation sources
Halogenlamps:mainly used in synchronously stimulated thermography as a radiation source for generating heat radiation with “smooth” time characteristics. Variations of active thermography with these lamps are popular under the names or Lock-In or phase sensitive (so named by analogy with the principle of operation of the Lock-In amplifier) and frequency- modulated (can be seen as a superposition of the Lock-In thermography). The use of halogen lamps as an energy source is necessary due to their relatively high efficiency, simplicity in use and possibility of control by amplitude modulation of conventional power units.
Pulsedlamps:this type of source is mainly applicable to the methods for determining the time thermal transmission properties of materials by means of a generator as a source of excitation. There are used the methods of the optical pulse thermography where the studied structure is heated by short (single) thermal energy waves from xenon flash that create energy density to 100 kJ/m2 for a period of a few ms to a few s. The method is known as active thermography inspection by heat wave and is mainly used to determine the transient thermal response of the object.
Non-opticalexcitationsources:ultrasound – It is used in the thermo-vibration systems. For this purpose, a source or sources of ultrasonic waves are used which, in their distribution in locations of inhomogeneity or defect create “acoustic friction”. Thus, heat is generated which affects the surface of the material and is visible to the thermal camera. A typical application of ultrasound sources and vibration-thermography is for inspection of materials with very low thermal conductivity. The application of synchronous vibration-thermography allows increasing the resolution of this method and study of thin thermal layers in places with difficult access. As mentioned before, non-optical excitation sources are out of the scope and will not considered in the proposed experimentation.
The required specifications for the excitation sources considered in the proposed experimentation have been identified and are given in the Table 3.2–Table 3.4.
Table 3.2: Flash lamps specifications
|
Standard flash head |
Ringflash |
|
|
Energy |
max. 6000 J |
max. 3000 J |
|
Flash frequency |
~ ¼ s |
|
|
Power connection |
110-230 V / 50-60 Hz |
|
|
Accessories |
Lamps, reflectors, filters |
|
Table 3.3: Halogen lamps specifications
|
Single lamps |
|
|
Power consumption |
500-1000 W / lamp @ 230V |
|
Lightoutput |
37.000 – 350.000 cd axial |
|
Modulation frequency |
Sensible up to max. 1Hz |
|
Accessories |
Reflectors, filters, robot mounting |
|
Halogenlamparray |
|
|
Power consumption |
4 x 650 W or 8 x 650 W |
|
Description |
Compact housing with air cooling and heat protective glass |
Table 3.4: Hot/cold gun specifications
|
Heating hose supply |
230 V / 50 Hz, compressed air approx. 2 bar |
|
Achievable air temperature |
Approx. 250 °C |
1.4 Conclusions
The specifications for the three IR sensors and the excitation sources have been identified. Especially, all the critical parameters in thermography inspection tasks were presented and the technical specifications of the thermography sensors for the three wavelengths were specified so as to meet the requirement of the problem. All the well-known excitation sources were also analytically presented and the technical specifications of the selected sources were determined.
Cite This Work
To export a reference to this article please select a referencing stye below:
Related Services
View all


DMCA / Removal Request
If you are the original writer of this essay and no longer wish to have your work published on UKEssays.com then please click the following link to email our support team:
Request essay removal