Impact of Multiple Types and Sizes of Charging Stations on Electric Power Grid
| ✅ Paper Type: Free Essay | ✅ Subject: Engineering |
| ✅ Wordcount: 6130 words | ✅ Published: 18 May 2020 |
Abstract—Environmental and energy issues are among the mainstream topics of the 21st century. The urge to reduce harmful vehicular emissions and changeover to alternative fuel sources have popularized the launch of electric vehicles. Electric vehicles offer the advantages which range from zero exhaust gas emission, reduced consumption of non-renewable energy such as coal and oil, comfort, safety, convenient and noise free operation, a long service life and much more. Transition to electric vehicles illustrates a shift to more efficient and cleaner electric drive systems. The charging infrastructure used for electric vehicle charging must be safe, convenient and financially feasible. The infrastructure, which is the power grid, must be able to manage the charging demands of the electric vehicle. While charging the electric vehicles, various factors of the power grid including voltage stability, reliability, power quality, power flow will be affected. This paper discusses the impact of EV charging on the aforementioned factors.
Keywords—electric vehicle, power grid, stability, reliability, power flow, power loss, power quality
I. Introduction
Internal combustion engines in vehicles is one of the major contributors towards air pollution and global warming. Hybrid electric vehicle (HEV), plug-in hybrid electric vehicle (PHEV), and battery electric vehicle (BEV) are cutting edge solutions to this issue. To charge these EV batteries, a large amount of electrical energy is required. This heavy demand for energy has serious repercussions on electric power grid. The most conventional method to charge a BEV is to connect a cable to it when the vehicle is stationary [1]. However, the charging time for this method is very high. An alternative for this method is the construction of battery swapping stations wherein, a depleted battery is replaced by a fully charged battery [2]. This solves the problem of long charging time faced in conventional method of charging via a cable. However, this method requires huge battery swapping stations and large storage spaces. It also involves creating global standards for batteries, which is quite challenging and demanding to actualize [3]. A novel concept of wireless charging is rudimentary level now and is under research currently [1][4][5][6]. Despite the wide range of advantages offered by Battery Electric Vehicle (BEV), one of the dominant reasons for its lower acceptance is its limited battery capacity. The battery capacity directly influences the vehicle’s driving range. In [7], the longest driving range of BEVs was observed to be 424 km and the shortest driving range to be 60 km. The driving range of most BEVs is distributed in the range of 100 km to 160 km [7]. The advantages, per contra, offered by the EVs far outweigh the limitations of BEV and hence they are becoming .
Recently, the impact of Electric Vehicle (EV) charging on power grids has been an area that has simulated great interest among researchers. The establishment of charging stations imposes an additional burden on the power grid. This will degrade the operating parameters of the distribution network. The uncoordinated charging of EVs may lead to increase in peak load, introduction of increased harmonics as well deterioration of voltage profile. Many studies conducted so far by the researchers exposes the adverse impact of EV charging loads on different parameters of the distribution network like voltage profile [8–14], harmonics [15–18] and peak load [19–24]. The charging from distribution systems can greatly affect the characteristics and standards of the grid such as system stability, reliability, power flow, power quality and power loss. This charging can also bring about congestion in the distribution network as well as result in transformer life span degradation. The purpose of this paper is to summarize the impacts of PEV charging on the electric grid.
.
II. impact of phev charging on various factors of power grid
A. Voltage Sensitivity Factor
Voltage stability can be defined as the ability of the system to retain system voltages within acceptable limits under normal operating conditions as well as when subjected to disturbances. Large-disturbance voltage stability is wherein the disturbance is large and, small-disturbance voltage stability is wherein the disturbance is small [25][26]. Voltage stability can be local phenomena or a global phenomenon. If only a specific bus or a specific area of bus is affected, it is a local phenomenon. In this case, the entire system is not affected. If a large number of system buses face voltage stability issue, it is a global phenomenon. Two factors namely Voltage Sensitivity Factor (VSF) and Voltage Stability Index (VSI) can be used for voltage stability analysis [31].
The voltage stability is analysed based on the determination of VSF from the PV curve [27][28][29]. The PV curve is a graphical representation of active power and voltage [27].
- The PV Curve
Consider a two-bus system. Assume that one bus acts as the sending end and the other as receiving
is the voltage of the sending end and
is the voltage of receiving ending. The transmission line is represented with impedance
. Assume that a load of impedence
is connected at the receiving end.
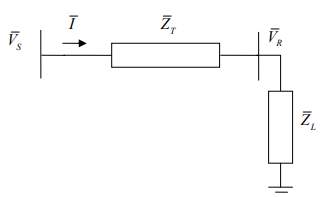
Fig.1 Single line diagram of two-bus system [30]
Taking
as the reference voltage, the magnitude of current in the transmission line is given as [30]
=
=
(1)
The receiving end voltage magnitude is [30]
=
(2)
The active and reactive power consumed by the load is given as [30]
=
(3)
=
(4)
The reactance to resistance ratio (R/X) is very high in a transmission line which implies tht resistance is extremely small and can be neglected. The value of
as well as
is also quite small. As illustrated by Equations (3) and (4), by decreasing the load impedance
, while keeping the power factor a constant, the active and reactive power of the load can be increased. The receiving end voltage is plotted against varying active power consumed by the load, to obtain the graph shown in Fig. 2 which is called as P-V curve [30].
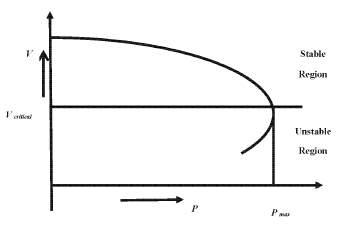
Fig. 2. Active Power Voltage Curve (PV curve). [30]
This curve shows the course of voltage change with respect to active power.
From the PV curve, the critical point of operation for the system stability can be determined. As shown in Fig. 2, as the active power increases, the voltage decreases to a specific point where the active power is the highest. This is the aforementioned critical operating condition. This is known as the limit of stable operation [31].
The ratio of change in voltage and change in loading is known as VSF. It can be expressed as [31]
VSF =
where,
is the power at limit of stable operation.
B. Voltage Stability Index
In [32], Eminoglu et al. developed an equation for stability index. The method by which this index was developed for a two-bus system is illustrated below:
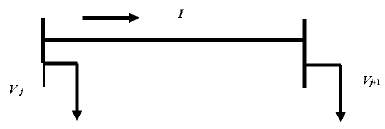
Fig.3. Single line diagram of a two-bus system [31]
Let j and j+1 be the two buses of the system. Vj < δj and Vj+1 < δj+1 be the voltages of j and j+1 respectively. The branch has resistance r and impedance x. I is the current flowing through the branch. The equations for current and complex power may be written as [31]
I =
(5)
(6)
Substitute the value of I in Equation (6), equate the real and imaginary parts, and simplify the equation as [31]:
)
(7)
The transferrable active power
may be written as [31]
=
(8)
where [31], M = -cos
and Q = –
–
–
x +
and,
(9)
where [31], P = -sin
and Q = –
–
–
r +
The conditions for existence of transferrable active and reactive power are [31]
N
0 and Q
0 (10)
Substituting the actual values of N, Q and adding those leads to the inequality defining the stability criterion of the system as [31]:
2
2
)
(11)
The value of the Equation (11) is known as VSI [31]. This inequality criterion determines the voltage stability of the system.
Typically, the PEV battery capacity ranges between 2 kW and 17 kW [33]. The power for PEV charging is dependent on the current and voltage requirements of the specific charger. Consequently, these factors also decide the time required to charge the battery [33]. Vehicles with large battery packs can place a high demand on current and voltage from the power grid, to get charged in a short time. This would in turn increase the active power demand. From Equation (11) it is clear that, as active power increases the value of equation decreases. The decrease in value of the Equation (11) means a decrease of VSI. If the value of VSI decreases significantly below 0, the system becomes unstable. Hence, the impact of charging station on voltage stability is that, charging stations demanding higher active power will cause the system to become unstable.
C. Reliability
Reliability of a system is defined as the probability that the system will not fail throughout a thetical duration of operation, under the given set of operating conditions. Customer satisfaction levels provide basis for measurement of reliability of distribution networks[31]. The distribution network reliability index is categorized as shown below:
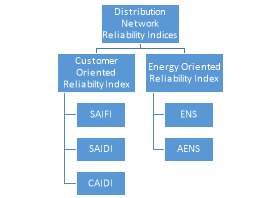
Fig. 4. Categorization of distribution network reliability index
For determination of reliability index for a distribution network, several parameters such as statistical data of failure rate, repair rate, average outage duration, and number of consumers of the buses of the distribution network are required [34][35].
System Average Interruption Frequency Index (SAIFI) is linked with the frequency and duration of interruption of service experienced by customers. In [31], SAIFI is defined as the number of times a system customer experiences interruption during a particular time period. It emphasizes the state of the system in terms of interruption. It is calculated as [31]:
SAIFI =
(12)
where
is the failure rate and
is the number of customers for location j.
System Average Interruption Duration Index (SAIDI) is also related with the frequency and duration of service interruption. [31] defines SAIDI as the average outage duration for each customer that is served. SAIDI illustrates the condition of the system in terms of duration of interruption. It is calculated as [31]:
SAIDI =
(13)
where,
is the annual outage time for customer at location j and
is the number of customers at location j.
Customer Average Interruption Duration Index (CAIDI) gives a measure of customer dissatisfaction which occurs due to service interruption. In [31], authors define CAIDI as the average interruption duration time for those customers interrupted during a year. CAIDI gives the average outage duration that any given customer would experience. It is calculated as [31]:
CAIDI =
(14)
Energy Not Supplied (ENS) is an indicator of the energy deficiency of the system [31]. It gives the total energy not supplied by the system. It can be calculated as [31]:
ENS =
(15)
where,
is the load factor of the corresponding line.
AENS gives an idea of how much energy is not served during a defined period of time. AENS is considered as the average system load curtailment index [31]. It can be calculated as [31]
AENS =
(16)
Voltage deviation beyond a threshold limit and AENS are critical to the system. Large deviations could impose a heavy burden on the system. High load increase in the distribution network can further increase the power loss in the system. It can also increase the outage duration for customers accessing certain buses [31]. This load increase can thus cause the reliability of the system to become poor.

When EV is connected to the power grid for charging, the load demand on the grid is increased. An increase in the load demand would result in frequent interruptions of customer services. Events like power outage, blackouts, etc. occur more frequently. The number of service interruptions and duration of interruption per customer also increases. This would eventually affect the reliability indices of the power system. When the reliability indices of the system degrade below their critical value, the system becomes unreliable. This means that in case of reliability indices less than their threshold value, the power system does not retain voltages within prescribed limits at all times.
The authors in [36] explain that, based on the Island Formation Strategy, the PHEV being distributed energy storage units, can act as local power island in the distribution system, when the distribution network has faults. Thus, it can reduce the frequency of occurrence of power outages and the length of blackout duration. However, the power restriction of the PHEV output makes it impossible for the PHEV to meet the demands of all load points in the island. For a balanced power condition within the island, the total generating capacity and load capacity in the system must satisfy the following criterion [36]:
(17)
where,
is the total PHEV power supply capacity within the island and
is the total load demand capacity within the island [36]. If this condition is satisfied, the system can act as a reliable one.
D. Power Loss
The below equations are based on the power flow analysis of the distribution system [37]. The analysis is based on the distribution network modelling [38].
The power loss-load demand relationship may be illustrated by the equation [37]
(18)
where, is the load demand of the distribution network, is the line impedance, is feeder voltage,
is transformer ratio and is transformer number [37]. Based on Equation (18) the power loss impact caused by PHEV charging can be represented by the equation [37]
(19)
where,
is PHEV load demand and
is background real time load demand. From Equation (19) it is clear that as the load demand placed by the PHEV increases the losses in the power systems also rise. The charging of PHEV at peak hours will increase total power loss tremendously as dictated by Equation (19).
In [47], the authors studied the effect of integration of PHEV loads onto a IEEE 14 bus system to analyse the impacts of PHEV charging on power grid. The active line losses profile plotted in the study before the introduction of PHEV load is shown in Fig.5.
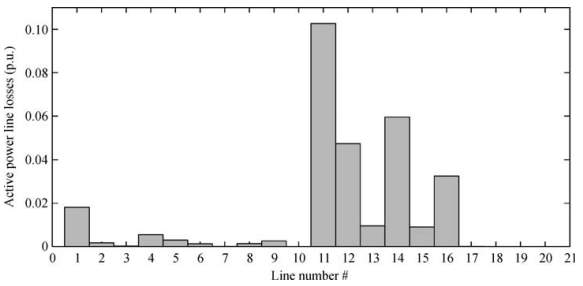
Fig.5. Active line losses of the bus system at base load [47]
The active line losses profile plotted after the introduction of PHEV load is shown in Fig.6.
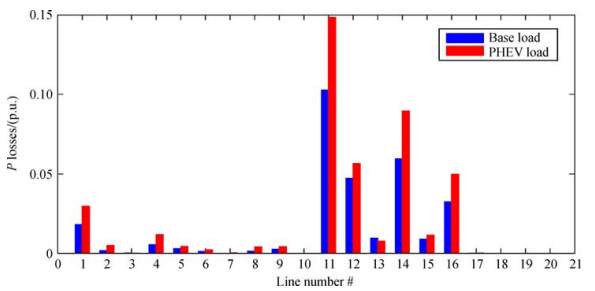
Fig. 6. Active line loss profile of the bus system after introduction of PHEV load [47]
The graph shows an increment in the active line losses upon integration of PHEV on to the distribution system. This is due to the fact that, increased charging demand caused by PHEV loads, increases the active power generated and the line current resulting in excessive voltage drops. This contributes towards the increased active line loss.
E. Power Quality
Power quality problems are associated with the harmonic distortion in power system, voltage unbalance, current unbalance, etc. When PEVs are connected to power grid, they charge by drawing low voltage AC power and converting it to DC. The AC signal is rectified initially and then passed through a DC/DC converter. Rectifier and the DC/DC converters are non-linear loads. Both the processes of rectification and conversion, being done by non-linear loads produce harmonic distortion on the distribution system [39].
AS stated in [39], electric vehicle chargers have many non-linear devices within them. It is known that non-linear loads cause current harmonics. The PEV chargers containing rectifiers and converters, when connected to the power grid, draws a voltage that may not be sinusoidal. The non-linear load thus produces a series of sinusoids that results in the appearance of fundamental frequency at integer multiples of the fundamental frequency [40]. The distribution systems are three phase systems. Each phase is 120⁰ apart. When there are different harmonics in the three phases, the total currents will not add to zero. The different harmonics in the three phases can add constructively or destructively. If constructive addition occurs, neutral currents may be generated. These currents can damage the power grids. Voltage harmonics are usually caused by current harmonics [40]. The current harmonics due to source impedance can distort the voltage provided by the power grid .
Total Harmonic Distortion (THD) is a measurement of the level of harmonic distortion present in the electrical power system. The power factor is related to THD as [41]
Power factor =
where,
is THD associated with voltage harmonics and
is the THD associated with current harmonics. Increase in THD can lead to decrease in power factor as illustrated by the above equation. A lower power factor implies that the apparent power, which is the actual power flowing in the network, is greater than the real power, which is the power absorbed by the load. This large apparent power consequently causes more current to be drawn from the grid which will in turn increase total energy lost. Overheating of power system equipment, disruption in the operation of protection and control equipment and blackout are some of the consequences of increase in harmonic current.
EVs are introduced in the market, which vary widely in their charger structures. Different charger structures produce different THD. Certain charger structures explained in [42] is used to illustrate the impact of those structures on power grid. A charger containing a rectifier that has a chopper, but no control Rectifier with chopper and no control methods generate high harmonic current and result in high THD. Another type of charger contains a rectifier with DC/DC converter and control methods. These chargers use a high frequency transformer in place of the chopper. They selectively extract high frequency and reduce the ripples in DC voltage. However, these charges also introduce much harmonics in the power system. These harmonics subsequently result in high THD values and hence affect the power quality [42].
The excessive number of EV charging particularly during peak hours can increase the introduction of harmonics, because EVs with different charger structures introduce large number of harmonics into the power system[42].
The charging of PEV also increases the voltage deviation and voltage unbalance in the system [43]. In a balanced three phase system, the phase voltages of all the phases should be equal. Voltage unbalance is the voltage difference between the voltages at three phases of the three phase system. The load from EV charging is not evenly distributed between the three phases of the power system. The load on one phase might be higher than the load on the other phases. The load on a phase can even be zero while that on the other two may be non-zero. The uneven EV load distribution can cause different voltage drops between different phases of the system hence, resulting in voltage unbalance. At the event of uncoordinated charging, the maximum bus-voltage deviation and voltage unbalance is observed [43]. When the penetration level of EV increases, the voltage on each bus decreases, obviously. Subsequently, the load current becomes higher and voltage drops further, resulting in excessive voltage drop and hence, voltage unbalance [46]. Power quality problems at the distribution level is voltage unbalance which also means unequal harmonic distortion levels, and phase angle deviation. The voltage unbalance causes the power system to have heating effects.
As per National Electrical Manufacture Association (NEMA), the voltage unbalance (in percent) or Line Voltage Unbalance Rate (LVUR) is defined as the ratio of maximum voltage deviation from the average line voltage to the average line voltage. However, IEEE uses the phase voltage rather than the line voltage [44], so the Phase Voltage Unbalance Rate (PVUR) is given by
The maximum voltage unbalance of the electrical supply system as recommended by NEMA is restricted to 3% [44].
F. Power Flow
In a charging station, electric energy from the distribution grid (AC Three Phase) is stepped down using a transformer to the voltage level of the charging station. The three phase AC/DC converter transforms the AC current into DC power and forms a DC bus. Electric vehicles are connected to the DC bus for charging through a DC/DC converter which accurately matches the voltage required by the battery.
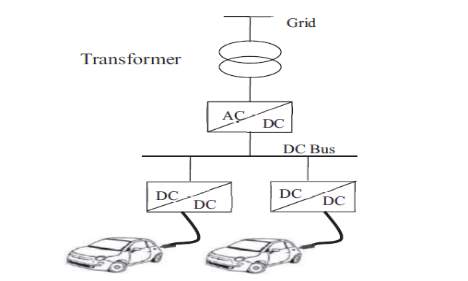
Fig. 7. Schematic diagram of charging station [46]
The working and power flow in a charging station can be explained using the schematic diagram shown below in Fig. 8. The electric vehicle is connected to the DC bus in the charging station via a battery charger (DC/DC converter). The charging plan utilized for the charging of the battery of electric vehicle is Constant Current-Constant Voltage (CC-CV) charging plan. In this scheme, the battery current is kept consistent at first and the battery voltage is permitted to increment until it comes to at a predefined value. This mode is called Constant Current (CC) mode [46].
When the voltage achieves this value, current is permitted to decrease and voltage is kept up consistent at the predefined value. This is known as Constant Voltage (CV) mode. Most of the charging is done during Constant Current (CC) mode [46].
The output suitable for the battery is generated by the DC/DC converter. Controller designed for CC-CV charging controls voltage and current parameters of the DC/DC converter. The input for the controller is the feedback of voltage and current rating from the battery. The flow chart for the program of CC-CV controller is given in Fig. 9.
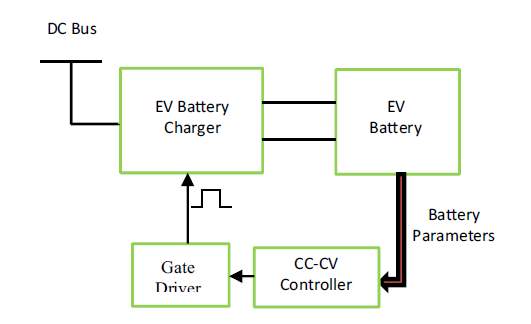
Fig.8. Electric vehicles charger control scheme [46]
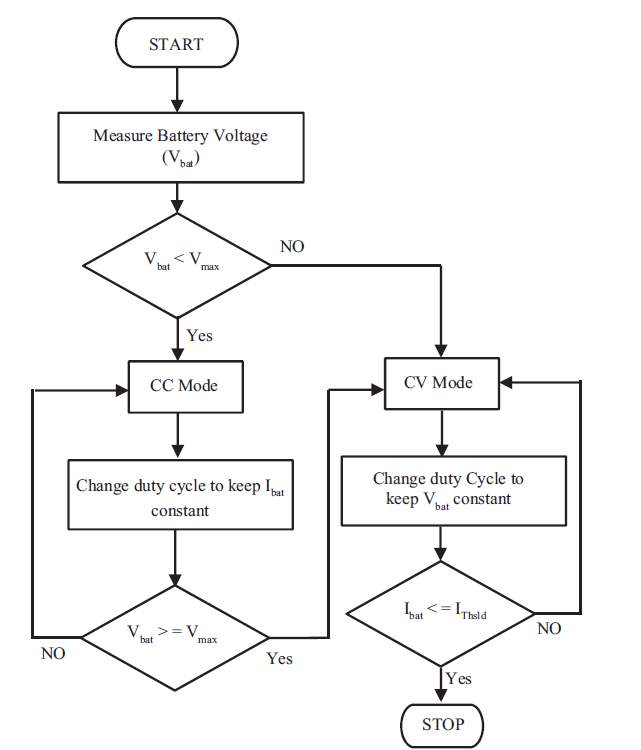
Fig.9. Flow chart for CC-CV charging [45]
Power flow analysis plays a key role in power system analysis and design. Consider a system that consists of N bus. The Equation (19) to (23) used below are adopted from [47], The injection of net power which is complex in nature, into any system bus k may be represented as
(19)
The current injected to bus k may be represented as
(20)
where,
is the element (y, k) of the admittance matrix Y. Also,
=
where G denotes conductance and B denotes susceptance.
Substituting Equation (20) in Equation (19), we obtain,
It is known that
has magnitude
and phase
. Hence the above equation may be written as
(21)
Substituting for
as
(sin
) in Equation (21), we obtain,
where,
=
. The above equation can be further simplified as
(22)
The complex power
has both real and imaginary parts wherein, the real part represents the active power and the imaginary part represents the reactive power. It can be represented as
(23)
where,
is the active power and
is the reactive power. Comparing Equation (22) and Equation (23), the equations for active power and reactive power may be written as
and,
In [48], the authors have conducted a study to trace the changes in voltage profile, active power profile and reactive power profile of the power grid, upon integration of PHEVs into the power grid. The study was done on IEEE 14 bus system developed in Simulink Simulation Environment and the results were plotted with the same. Based on the study, the voltage magnitude profile plotted before the integration of PHEV load on to power system is shown in Fig. 10.
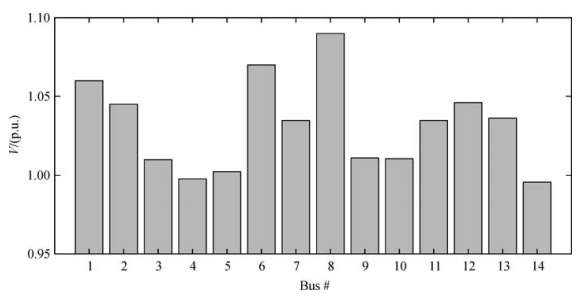
Fig. 10. Voltage magnitude of 1EEE 14 bus system at base load [48]
The voltage magnitude profile of the bus system plotted after the introduction of PHEV loads onto the all buses except bus numbers 1,2,3,6 and 8 is shown in Fig. 11.
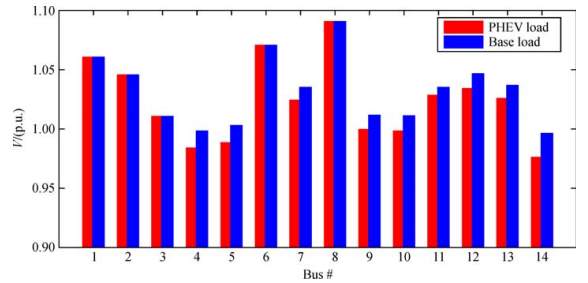
Fig. 11. Voltage magnitude profile of the bus system after introduction of PHEV load [48]
Comparing Fig.10 and Fig.11, it can be observed that there is a degradation in voltage magnitude of the buses where the PHEV loads were connected. This degradation can be attributed to the increased load demand placed by the PHEVs.
Similarly, the active power profile of the bus system before integration of PHEV into power system is shown in Fig. 12. Fig. 13 shows the active power profile after the introduction of PHEV load on to bus number 1. Comparing Fig.12 and Fig.13, it is revealed that there has been a significant increase in the active power generated upon the penetration of PHEV load onto the distribution network. This escalation of active power generated can be attributed to the necessity to meet the increased charging demand by the PHEV load. Higher active power generated means higher line current.
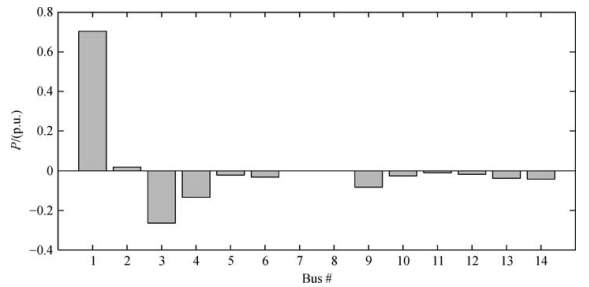
Fig.12 Active power profile of the bus system at base load [48]
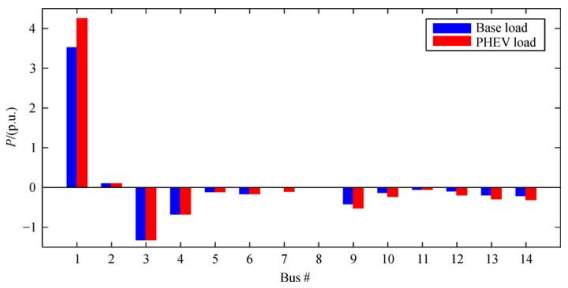
Fig.13. Active power profile of the bus system after introduction of PHEV load onto bus number 1 [48]
G. Miscellaneous Impacts
Integration of PHEVs onto distribution networks can cause some other impacts as:
- Congestion
The EV vehicle owners are free to charge their vehicle batteries any time for any duration. In this scenario of uncoordinated charging the power network may not be able to serve the demands of all the customers. The customers include the EV owners and the residential customers. The case becomes worse with the simultaneous charging of several EVs during peak load hours. This uncoordinated charging can lead to congestion in the distribution network.
- Transformer degradation
An aftermath of increase in PEV penetration, increased harmonic distortion, uncoordinated charging patterns, increased temperature can adversely affect the life span of the transformer over long term. These factors can contribute towards the decrease in efficiency and life span of the transformer [33]
III. Conclusion
Before you begin to format your paper, first write and save the content as a separate text file. Complete all content and organizational editing before formatting. Please note sections A-D below for more information on proofreading, spelling and grammar.
Keep your text and graphic files separate until after the text has been formatted and styled. Do not use hard tabs, and limit use of hard returns to only one return at the end of a paragraph. Do not add any kind of pagination anywhere in the paper. Do not number text heads-the template will do that
References
[1] Haghbin, S.; Khan, K.; Lundmark, S.; Alakvla, M.; Carlson, O.; Leksell, M.; Wallmark, O. Integrated chargers for EV’s and PHEV’s: Examples and new solutions. In Proceedings of the 2010 XIX International Conference on Electrical Machines (ICEM), Rome, Italy, 6–9 September 2010; pp. 1–6.
[2] Xu, M.; Meng, Q.; Liu, K. Network user equilibrium problems for the mixed battery electric vehicles and gasoline vehicles subject to battery swapping stations and road grade constraints. Transp. Res. Part B 2017,99, 138–166 [CrossRef]
[3] Adler, J.D.; Mirchandani, P.B. Online routing and battery reservations for electric vehicles with swappable batteries. Transp. Res. Part B Meth. 2014, 70, 285–302. [CrossRef]
[4] Jang, Y.J.; Ko, Y.D.; Jeong, S. Optimal design of the wireless charging electric vehicle. In Proceedings of the 2012 IEEE International Electric Vehicle Conference (IEVC), Greenville, SC, USA, 4–8 March 2012; pp. 1–5.
[5] Budhia, M.; Boys, J.T.; Covic, G.A.; Huang, C.Y. Development of a single-sided flux magnetic coupler for electric vehicle ipt charging systems. IEEE Trans. Ind. Electr. 2013, 60, 318–328. [CrossRef]
[6] Pelletier, S.; Jabali, O.; Laporte, G. Battery Elevtric Vehicles for Goods Distribution: A Survey of Vehicle Technology, Market Penetration, Incentives and Practices. 2014. Available online: https://www.cirrelt.ca/ DocumentsTravail/CIRRELT-2014-43.pdf (accessed on 19 July 2019).
[7] Huang, K.; Kanaroglou, P.; Zhang, X. The design of electric vehicle charging network. Transp. Res. Part D 2016, 49, 1–17. [CrossRef]
[8] Geske, M.; Komarnicki, P.; Stötzer, M.; Styczynski, Z.A. Modeling and simulation of electric car penetration in the distribution power system—Case study. In Proceedings of the International Symposium on Modern Electric Power Systems, Wroclaw, Poland, 1 September 2011; pp. 1–6.
[9] Juanuwattanakul, P.; Masoum, M.A. Identification of the weakest buses in unbalanced multiphase smart grids with plug-in electric vehicle charging stations. In Proceedings of the Innovative Smart Grid Technologies, Perth, Australia, 13–16 November 2011; pp. 1–5.
[10] Zhang, C.; Chen, C.; Sun, J.; Zheng, P.; Lin, X.; Bo, Z. Impacts of electric vehicles on the transient voltage stability of distribution network and the study of improvement measures. In Proceedings of the IEEE Asia Pacific Power and Energy Engineering Conference(APPEEC), Hong Kong, China, 7–10 December 2014; pp. 1–6.
[11] Dharmakeerthi, C.H.; Mithulananthan, N.; Saha, T.K. Impact of electric vehicle fast charging on power system voltage stability. Int. J. Electr. Power Energy Syst. 2014, 57, 241–249. [CrossRef]
[12] Ul-Haq, A.; Cecati, C.; Strunz, K.; Abbasi, E. Impact of electric vehicle charging on voltage unbalance in an urban distribution network. Intell. Indus. Syst. 2015, 1, 51–60. [CrossRef]
[13] De Hoog, J.; Muenzel, V.; Jayasuriya, D.C.; Alpcan, T.; Brazil, M.; Thomas, D.A.; Jegatheesan, R. The importance of spatial distribution when analysing the impact of electric vehicles on voltage stability indistribution networks. Energy Syst. 2015, 6, 63–84. [CrossRef]
[14] Zhang, Y.; Song, X.; Gao, F.; Li, J. Research of voltage stability analysis method in distribution power system with plug-in electric vehicle. In Proceedings of the IEEE Asia Pacific Power and Energy Engineering, Xi’an, China, 25–28 October 2016; pp. 1–6.
[15] Staats, P.T.; Grady, W.M.; Arapostathis, A.; Thallam, R.S. A statistical analysis of the effect of electric vehicle battery charging on distribution system harmonic voltages. IEEE Trans. Power Deliv. 1998, 13, 640–646.[CrossRef]
[16] Gómez, J.C.; Medhat, M.M. Impact of EV battery chargers on the power quality of distribution systems. IEEE Trans. Power Deliv. 2003, 18, 975–981. [CrossRef]
[17] Basu, M.; Gaughan, K.; Coyle, E. Harmonic distortion caused by EV battery chargers in the distribution systems network and its remedy. In Proceedings of the 39th International Universities Power Engineering Conference, Bristol, UK, 6–8 September 2004; pp. 1–6.
[18] Jiang, C.; Torquato, R.; Salles, D.; Xu, W. Method to assess the power-quality impact of plug-in electric vehicles. IEEE Trans. Power Deliv. 2014, 29, 958–965. [CrossRef]
[19] McCarthy, D.; Wolfs, P. The HV system impacts of large scale electric vehicle deployments in a metropolitan area. In Proceedings of the 20th Australasian Universities Power Engineering Conference, Christchurch, New Zealand, 5–8 December 2010; pp. 1–6.
[20] Putrus, G.A.; Suwanapingkarl, P.; Johnston, D.; Bentley, E.C.; Narayana, M. Impact of electric vehicles on power distribution networks. In Proceedings of the Vehicle Power and Propulsion Conference, Dearborn, MI, USA, 7–10 September 2009; pp. 1–6.
[21] Fan, Y.; Guo, C.; Hou, P.; Tang, Z. Impact of Electric Vehicle Charging on Power Load Based on TOU Price. Energy Power Eng. 2013, 5, 1347–1352. [CrossRef]
[22] Di Silvestre, M.L.; Riva Sanseverino, E.; Zizzo, G.; Graditi, G. An optimization approach for efficient management of EV parking lots with batteries recharging facilities. J. Ambient. Intell. Hum. Comput. 2013, 4, 641–649. [CrossRef]
[23] Fakeha, S.; Manisa, P.; Rahman, S. Demand management to mitigate impacts of plug-in electric vehicle fast charge in buildings with renewables. Energy 2017, 120, 642–651.
[24] Hüls, J.; Anne, R. Coordinated charging strategies for plug-in electric vehicles to ensure a robust charging process. In Proceedings of the 10th EAI International Conference on Performance Evaluation Methodologies and Tools on 10th EAI International Conference on Performance Evaluation Methodologies and Tools, Taormina, Italy, 25–28 October 2016.
[25] IEEE, Special publication 90TH0358-2-PWR, Voltage stability of power systems: concepts, analytical tools, and industry experience, 1990.
[26] CIGE task force 38-02-10, Modelling of voltage collapse including dynamic phenomena, 1993.
[27] Kundur, P. Power System Stability and Control; Balu, N.J., Lauby,M.G., Eds.;McGraw-Hill: New York, NY, USA, 1994; Volume 7.
[28] Lis, R.A. Voltage Stability Assessment Using Bus PQ Curve. Available online: http://www.wseas.us/elibrary/conferences/2013/Nanjing/SCIE/SCIE-01.pdf (accessed on 18 July 2017).
[29] Rahman, M.M.; Barua, S.; Zohora, S.T.; Hasan, K.; Aziz, T. Voltage sensitivity based site selection for PHEV charging station in commercial distribution system. In Proceedings of the Asia Pacific Power and Energy Engineering Conference, Hong Kong, China, 8–11 December 2013; pp. 1–6.
[30] “Chapter 8 Voltage stability,” NPTEL. [Online]. Available: https://nptel.ac.in/courses/108106026/chapter8.pdf. [Accessed: 20-Jul-2019]
[31] S. Deb, K. Tammi, K. Kalita, and P. Mahanta, “Impact of Electric Vehicle Charging Station Load on Distribution Network,” Energies, vol. 11, no. 1, p. 178, Jan. 2018.
[32] Eminoglu, U.; Hocaoglu, M.H. A voltage stability index for radial distribution networks. In Proceedings of the 2007 42nd International Universities Power Engineering Conference, Brighton, UK, 4–6 September 2007; pp. 408–413.
[33] R. Liu, L. Dow, and E. Liu, “A survey of PEV impacts on electric utilities,” Isgt 2011, pp. 1–8, 2011
[34] Chowdhury, A.; Koval, D. Power Distribution System Reliability: Practical Methods and Applications; John Wiley & Sons: Hoboken, NJ, USA, 2015.
[35] Billinton, R.; Alen, R. Reliability Evaluation of Power Systems, 2nd ed.; Plenum: New York, NY, USA, 1994; pp. 400–442
[36] Liu, W., Zhang, M., Zeng, B., Wu, L. and Zhang, J. (2012). Analyzing the impacts of electric vehicle charging on distribution system reliability. In: IEEE PES Innovative Smart Grid Technologies. [online] IEEE, pp.1-6. Available at: https://ieeexplore.ieee.org/abstract/document/6303249 [Accessed 22 Jul. 2019].
[37] Yang, Z.;”Impact of plug-in hybrid electric vehicles charging on distribution networks,” MS thesis, School of Electrical and Computer Engineering College of Science, Engineering and Health, RMIT University, Melbourne, Aus., 2012. Accessed on: 22 Jul. 2019. Available: https://pdfs.semanticscholar.org/6229/1830f797db7d76a98f044800e0a643b5d08e.pdf
[38] Kersting, W.H. (2007) Distribution System Modeling and Analysis. CRC Press, Boca Raton. http://dx.doi.org/10.1201/9781420009255.ch21
[39] C. Farmer, et al, “Modeling the Impact of Increasing PHEV Loads on the Distribution Infrastructure,” This paper appears in: System Sciences (HICSS), 2010 43rd Hawaii International Conference, January 2010.
[40] “Harmonics (electrical power),” Wikipedia, 12-Apr-2019. [Online]. Available: https://en.wikipedia.org/wiki/Harmonics_(electrical_power). [Accessed: 26-Jul-2019]
[41] W. M. Grady and R. J. Gilleskie, “Harmonics and how they relate to power factor,” in Proc. of the EPRI Power Quality Issues & Opportunities Conference, pp. 1–8.
[42] Monteiro, V., Goncalves, H., Afonso, G.L. (2011). Impact of Electric Vehicles on Power Quality in a Smart Grid Context. IEEE International Conference on Electrical Power Quality and Utilization (EPQU), Oct.
[43] A. von Jouanne and B. Banerjee, “Assessment of voltage unbalance,” IEEE Transactions on Power Delivery, vol. 16, pp. 782-790, 2001.
[44] Alharbi, Abdulelah Yousef, “Impact of plug in electric vehicle battery charging on a distribution system based on real-time digital simulator” (2013). Theses and Dissertations
[45] A. Ul-Haq, C. Cecati, K. Strunz, and E. Abbasi, “Impact of Electric Vehicle Charging on Voltage Unbalance in an Urban Distribution Network,” Intelligent Industrial Systems, vol. 1, no. 1, pp. 51–60, May 2015
[46] W. Khan, F. Ahmad, and M. S. Alam, “Fast EV charging station integration with grid ensuring optimal and quality power exchange,” Engineering Science and Technology, an International Journal, vol. 22, no. 1, pp. 143–152, 2019
[47] F. Milano, “Power flow analysis,” in Power System Modelling and Scripting, 1st ed., Springer-Verlag Berlin Heidelberg, 2010, pp. 62–69.
[48] R. Boudina, J. Wang, M. Benbouzid, F. Khoucha, and M. Boudour, “Impact evaluation of large scale integration of electric vehicles on power grid,” Frontiers in Energy, 2018
Cite This Work
To export a reference to this article please select a referencing stye below:
Related Services
View all


DMCA / Removal Request
If you are the original writer of this essay and no longer wish to have your work published on UKEssays.com then please click the following link to email our support team:
Request essay removal