Finding the Equilibrium of Iron & the Thiocyanate
| ✅ Paper Type: Free Essay | ✅ Subject: Chemistry |
| ✅ Wordcount: 1716 words | ✅ Published: 18 May 2020 |
Finding the Equilibrium of
Introduction
Background
Thiocyanate (SCN-) is natural occurring in the human body that is secreted in the salivary glands. ¹ It is produced with the digestion of food and drugs used specifically to treat thyroid disorders or hypertension. High thiocyanate levels are indicative of cyanide poisoning² but could also be used to assess smoke exposure. Spectrophotometers are used in order to view the concentration of SCN- in a solution.
Theory
Metal ions can form bonds with ligands; however, they often become complex and each have individual equilibria. The equilibrium constant will correlate with the binding affinity of the metal ion and ligand, which is in this case iron (Fe+3) and thiocyanate (SCN-) respectively. The iron and the thiocyanate should create a complex
Its concentration could then be found by a spectrophotometer set at a wavelength of 447 m. Through the calculated concentrations and the absorbance found through the spectrophotometers, the calibration curve could be created with this data. ICE tables can be used to find the equilibrium constant of five different concentrations of
Hypothesis
If a solution has a high amount of thiocyanate then it will have a greater bonding affinity..
Objective
The objective is to find the equilibrium constant of
Methods
Part 1 Methods
In order to create 0.5 M of 250 mL HNO3, 1 M of 125 mL HNO3 and 125 mL of DI water were placed in a 250 mL volumetric flask and mixed together. In order to create Fe(NO3)3, 1.21 g of Fe2(NO3)2 was mixed with 25 mL 0.5 M HNO3 in a 25 mL volumetric flask. In order to create KSCN, 0.010 g of KSCN was mixed with 50 mL of 0.5 HNO3 in a 50 mL volumetric flask.
2.5 mL of Fe(NO3)3 was added in each of the five test tubes using a 5 mL pipette. In test tube #1, 0.5 mL KSCN and 7 mL HNO3 were added. In test tube #2, 0.75 mL KSCN and 6.75 mL HNO3 were added. In test tube #3, 1 mL KSCN and 6.5 mL HNO3 were added. In test tube #4, 1.25 mL KSCN and 6.25 mL HNO3 were added. In test tube #5, 1.5 mL KSCN and 6 mL HNO3 were added. All five of the test tubes should have a total volume of 10 mL each.

A spectrophotometer was then used to find the absorbance at the wavelength 447 m. Each of the solutions needed to be diluted with 2 mL solution and 2 mL HNO3 when adding into the capsule for spectrophotometer testing. A calibration curve was created using the data obtained (absorbency) and the calculated concentrations.
Part 2 Methods
In order to create 0.5 M of 250 mL HNO3, 1 M of 125 mL HNO3 and 125 mL of DI water were placed in a 250 mL volumetric flask and mixed together. In order to create 0.002M solution of Fe(NO3)3, 0.2 M of 0.02 g Fe(NO3)2 was mixed with 50 mL 0.5 M HNO3 in a 50 mL volumetric flask. In order to create 0.002 M KSCN, 0.01 g of KSCN was mixed with 50 mL of 0.5 HNO3 in a 50 mL volumetric flask.
5 mL of Fe(NO3)3 was added in each of the five test tubes using a 5 mL pipette. In test tube #1, 1 mL KSCN and 4 mL HNO3 were added. In test tube #2, 2 mL KSCN and 3 mL HNO3 were added. In test tube #3, 3 mL KSCN and 2 mL HNO3 were added. In test tube #4, 4 mL KSCN and 1 mL HNO3 were added. In test tube #5, 5 mL KSCN was added. All five of the test tubes should have a total volume of 10 mL each.
A spectrophotometer was then used to find the absorbance at the wavelength 447 m. Each of the solutions needed to be diluted with 2 mL solution and 2 mL HNO3 when adding into the capsule for spectrophotometer testing. A calibration curve was created using the data obtained: absorbency and the concentrations. The Keq was found using ICE tables.
Safety
|
Chemical Name |
Chemical Formula |
Molecular Weight |
Potential Hazards |
Safety Equipment Needed |
Precautions used |
|
Nitric Acid |
HNO3 |
63.01 g/mol |
Oxidizing liquid, corrosive to metal, acute inhalation toxicity, skin and eye damage/irritation |
Wear safety goggles, gloves, and lab coat |
Use under fume hood. Do not breathe in vapors or mist. |
|
Iron (II) Nitrate |
Fe(NO3)3 |
241.86 g/mol |
Skin and eye irritation; dangerous to certain organs |
Wear safety goggles, gloves, and lab coat |
Avoid contact with eyes, skin, or clothing. Do not store with oxidizer |
|
Potassium thiocyanate |
KSCN |
97.181 g/mol |
Eye, skin, inhalation, and ingestion |
Wear safety goggles, gloves, and lab coat |
Use only in chemical fume hood. |
Results
Part 1 Results
|
Test Tubes |
Concentration of
|
Absorbance |
|
1 |
0.00005 |
0.25 |
|
2 |
0.000075 |
0.36 |
|
3 |
0.0001 |
0.58 |
|
4 |
0.000125 |
0.64 |
|
5 |
0.00015 |
0.79 |
Table 2:
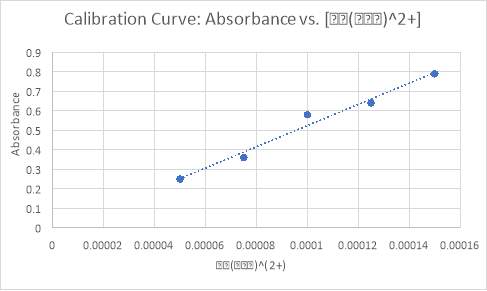
Graph 1: Results from table 2 were plotted. The
concentration was found using calculations whereas the absorbance was found using the spectrophotometer.
Part 2 Results
|
Test Tubes |
Concentration of
|
Absorbance |
|
1 |
0.000022509 |
0.1 |
|
2 |
0.00003125 |
0.15 |
|
3 |
0.000027574 |
0.13 |
|
4 |
0.000042279 |
0.21 |
|
5 |
0.000047794 |
0.24 |
Table 3
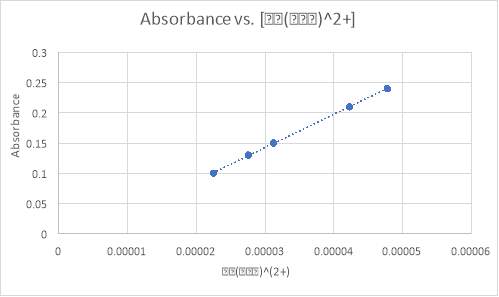
Graph 2: Results from table 3 were plotted. The
concentration was found using calculations whereas the absorbance was found using the spectrophotometer.
|
Test Tube |
Keq |
|
1 |
166.07 |
|
2 |
87.479 |
|
3 |
101.96 |
|
4 |
58.261 |
|
5 |
52.7 |
Table 4: The equilibrium was found using the M1V1=M2V2 equation then using ICE tables.
Calculations
Example of how concentration was found in part 1:
M1V1=M2V2 (M1= molarity of KSCN V1= volume of KSCN M2= unknown volume of
the solution V2= total volume in test tube)
0.002*0.5=M2*10
M2=0.0001/2 (to account for dilution)
M2= 0.00005
Example of how Keq was found in part 2:
|
Fe+3 |
SCN- |
||
|
I |
0.0005 |
0.0006 |
0 |
|
C |
-x |
-x |
+x |
|
E |
0.0005-x |
0.0006-x |
x |
Finding molarity of Fe+3
M1V1=M2V2
(0.001)(5)=M2(10)
M2=0.0005 M Fe+3
Finding molarity of SCN-
M1V1=M2V2
(0.002)(3)=M2(10)
M2=0.00006 M SCN-
Equilibrium expression:
Keq= (0.000027574) / (0.0005-0.000027574)(0.0006-0.000027574)
Keq= 101.96
Discussion
Part 1 Discussion
When the solutions were created in the test tubes, there seemed to be a gradient from light to dark on test tubes 1 to 5 indicating the increasing quantities of KSCN in each of the test tubes. When the group was performing the spectrophotometer analysis for absorbency, it showed numbers greater than 1 for test tube #1. This may be attributed to the fact that the nitric acid was prepared by another group, and there is no way to account for their mistakes. In order to fix this, 2 mL solution was diluted in 2 mL nitric acid. Since it was diluted twice, the concentrations found using calculations were divided by half. As a result, the concentration of
and absorbency had a positive correlation as seen by the near-linear plot on graph 1.
Part 2 Discussion
Again, a similar process as part 1 was done instead with different volumes of solutions. Prior to placing the solutions into the spectrophotometer, they were diluted as well for consistency. The concentration versus absorbency had a positive correlation as well as indicated by the near-linear graph 2. In addition, the equilibrium needed to be found. In general, it had a negative trend from test tubes 1 to 5. There was a slight discrepancy in the equilibrium of test tube 2 being 87.479 whereas the equilibrium of test tube 1 was 166.07 and the equilibrium of test tube 3 was 101.96. This may have been an error in calculation; otherwise, they display a downward trend in equilibrium.
Sources of Error
The nitric acid in week 1 were not prepared for the group. It may explain why we needed to dilute our solution in the first place. Perhaps it was contaminated. Additionally, some of the pipettes did not function well and continued to leak. This could explain discrepancies in volume. Although the goal was to fill the test tubes each with 10 mL of solution comprising of their specific dosages, that may not be accurate due to the pipettes.
Changes to the Experiment
A suggested change to the experiment is to allow each group to create their own necessary component i.e. the nitric acid. There are too many possible sources of error that cannot be accounted for when relying on others. Also, working equipment should be available to eliminate the need to compensate for volume. The pipettes should have been the most accurate measure of volume during the experiment, and if they are not functioning correctly, the accuracy of the entire experiment is questionable.
Conclusion
The purpose of this experiment was to find the equilibrium constant of five different concentrations of
As mentioned before, a high equilibrium constant correlates with a high bonding affinity. In the experiment it was seen that low thiocyanate levels have high bonding affinity. In test tube 1, there was only 1 mL KSCN added which had an equilibrium constant of 166.07. In test tube 2, there was only 2 mL KSCN added which had an equilibrium constant of 87.479. In test tube 3, there was only 3 mL KSCN added which had an equilibrium constant of 101.96. In test tube 4, there was only 4 mL KSCN added which had an equilibrium constant of 58.261. In test tube 5, there was only 5 mL KSCN added which had an equilibrium constant of 52.7. As one can see, low thiocyanate levels result in a stronger bond to Fe+3.
Although there was a slight discrepancy on test tube 2 having a lower equilibrium constant that test tube 3, the rest of the data indicate that low thiocyanate levels have high affinity bonds. This discrepancy could be attributed to the fact that another group created a key ingredient of the experiment or that the pipettes were not functioning correctly and did not deliver accurate volumes of each of the solutions.
A major concern with this data was that it was only performed once. There should have been at least 3 trials of it. Perhaps if the equilibrium constant of part 1 was found, it could confirm the results of part 2 as well.
Research Connection
An experiment by Silvia et al. aims to find the thiocyanate concentration in human saliva. ³ As mentioned before, thiocyanate is naturally occurring¹ and human saliva can be used in lieu of the potassium thiocyanate that was used in the lab. Saliva samples were collected from both smokers and non-smokers then it was diluted with DI water. The goal of their experiment was to see which method is most efficient in detecting high thiocyanate levels indicative of smoking status. They found that the micropumping multicommutation flow system was the best option because it had high success rates of distinguishing between smokers and non-smokers.
References
- ¹ Butts, W. C.; Kuehneman, M.; Widdowson, G. M.Automated method for determining serum thiocyanate, to distinguish smokers from nonsmokers. Clin. Chem.1974, 20, 1344–1348.
- ² Tsuge, K.; Kataoka, M.; Seto, Y.Cyanide and thiocyanate levels in blood and saliva of healthy adult volunteers. J. Health Sci.2000, 46, 343–350.
- ³ Silva Junior, J., Farias, M., Silva, V., Montenegro, M., Araujo, A., Lavorante, A., & Paim, A. P. Spectrophotometric Determination of Thiocyanate in Human Saliva Employing Micropumping Multicommutation Flow System. Spectroscopy Letters. 2010, (3), 213.
Cite This Work
To export a reference to this article please select a referencing stye below:
Related Services
View all


DMCA / Removal Request
If you are the original writer of this essay and no longer wish to have your work published on UKEssays.com then please click the following link to email our support team:
Request essay removal