Experiments Exploring what Factors Affect Reaction Rates
| ✅ Paper Type: Free Essay | ✅ Subject: Chemistry |
| ✅ Wordcount: 2476 words | ✅ Published: 18 Jan 2018 |
ABSTRACT
An area in chemistry that focuses on the speed or rate at which a chemical reaction takes place is chemical kinetics. In drug making, in pollution control and in food processing, knowledge about the rate of reaction is useful (Chang, 2010). Since chemical kinetics has a widespread application in our daily lives, it is just right to take a deeper look into this field. Moreover, the determination of factors affecting reaction rates is essential in this study. Thus, the focus of this experiment was to determine the effects of some of these factors on reaction rates. This was done by having a specific variable altered in two or more setups in each part of the experiment like the nature of the reactants, concentration, temperature, surface area and the presence of a catalyst. Conclusions were drawn based on the results obtained from the experiment. It was shown that an increase in temperature, surface area and concentration leads to an increase of the reaction rate, also the more reactive the reactants in nature the faster the reaction rate. Lastly, the addition of catalyst resulted to an increase in reaction rate.
INTRODUCTION
Kinetics oftenly suggests a definition that pertains to movement and change or, in terms of energy, the energy that is harnessed through an object’s motion. Chemical kinetics, however, refers to the branch of chemistry that deals with the speeds at which a chemical reaction occurs. Kinetics also refers to the rate of a reaction, or the reaction rate, which can be defined as the change in the concentration of a reactant or product with respect to time (Chang, 2010).
Due to the fact that the actual manner in which a reaction occurs is not yet fully understood, the following reaction rate theories are commonly used to explain how reactions happen: the Collision Theory and the Transition State Theory. According to the Collision Theory, all reactions happen as the result of collisions of the reacting molecules. However, not all collisions are successful in producing a reaction. For a collision between molecules to be productive, they must possess the minimum amount of energy required which is the activation energy (Ea) and the proper orientation. On the other hand, it is stated by the Transition State Theory that an intermediate complex or transition state complex, that cannot be isolated, is produced prior to the formation of the final product (Engle & Ilao, 2007). In addition to these reaction rate theories, it is also vital to the total comprehension of the behavior of reaction rates to understand how certain factors can affect them. Through the manipulation of the nature and concentration of reactants, temperature, presence of a catalyst, and surface area, we are able to examine and observe how these factors can alter or change the rate of the chemical reaction.
The experiment aims to determine the effects of those stated factors on the rates of chemical reactions. The determination of the rate law expression using the method of initial rates is also an objective of the experiment. Lastly, the value of the activation energy of a reaction should also be evaluated through accomplishing the experiment.
METHODOLOGY
All the necessary apparatus and reagents were gathered and prepared prior to the conduction of the experiment. The effects of the factors affecting reaction rates were observed in five separate parts of the procedure. The first factor to be tested was the nature of the reactants. Two test tubes were labelled as A and B. Each test tube contained 3 ml of water (H2O). In test tube A, a strip of magnesium ribbon (Mg) was added while in test tube B, a small piece of sodium metal (Na) was added. Observations were then recorded.

The second factor that had been tested was the concentration of reactants. Two setups were prepared, hydrochloric acid (HCl) concentration was held constant while sodium thiosulfate (Na2S2O3) concentration was variable for the first part. In contrast, HCl concentration was the variable while Na2S2O3 concentration was kept constant in the second setup. An empty 10-ml beaker was placed on a piece of white paper marked with an “X.” Then, a specific volume of 0.15 M Na2S2O3 was then placed inside the beaker. The researchers were tasked to check if the mark was still visible through the solution. Thereafter, a corresponding volume of H2O and 3 M HCl was added immediately. The time from the moment the HCl was added to the moment the mark was no longer visible had been recorded. The stated process was done ten times with varying volumes of reagents.
|
0.15 M Na2S2O3 (ml) |
H2O (ml) |
3 M HCl (ml) |
|
I. Constant HCl Concentration |
||
|
5 |
0 |
1 |
|
4 |
1 |
1 |
|
3 |
2 |
1 |
|
2 |
3 |
1 |
|
1 |
4 |
1 |
|
II. Constant Na2S2O3 Concentration |
||
|
5 |
0 |
2.5 |
|
5 |
0.5 |
2.0 |
|
5 |
1.0 |
1.5 |
|
5 |
1.5 |
1.0 |
|
5 |
2.0 |
0.5 |
The third factor that was put into the test was temperature. Two test tubes were prepared, one with 5 ml of 0.15 M Na2S2O3 while the other contained 7.5 ml of H2O and 2 ml of 3 M HCl. Both test tubes were immersed in a water bath containing tap water for 5 minutes. Both solutions were mixed in a 50 ml beaker placed on top of a piece of white paper marked with X. The time from the moment the solutions were placed in the beaker to the moment the mark was no longer visible had been recorded. This process was repeated at two other temperatures: one approximately 10ºC lower than room temperature and the other approximately 10ºC greater.
To test the surface area for the fourth part, two identical strips of Mg ribbon were needed, one was cut into smaller pieces and the other remained uncut. The uncut Mg ribbon and the shredded Mg ribbon were placed in separate test tubes. Then, 5 ml of 3 M HCl was added to both test tubes. Observations were then noted.
The last factor, the presence of a catalyst was also tested by preparing two test tubes. In each of the two test tubes, 5 ml of 3% hydrogen peroxide (H2O2) was placed with about 1 g of Rochelle salt or sodium potassium tartrate. One test tube was then heated gently while a pinch of cobalt (II) chloride (CoCl2) was added to the other test tube before it was heated gently. Observations had been recorded.
RESULTS AND DISCUSSION
The results from the first part of the experiment, where the nature of reactants was the factor to be tested, is shown by Table 1. The reaction profile of both reactions are presented by Figure 1.
Table 1. Observations on the Nature of Reactants
|
Reactants |
Visible Results |
|
A – Mg ribbon |
Formation of small bubbles on the surface of the Mg ribbon; Very slow reaction compared to test tube B |
|
B – Na metal |
Evolution of gas; Solution turned murky white with bubbles; Formation of heat; Fast reaction compared to test tube A |
It is evident from the results of the experiment that the reaction of Na metal with water has a lower activation energy compared to that of Mg ribbon. It is proven by how the reaction of Na metal was the faster and more reactive reaction, which can only mean that it has an activation energy low enough to be easily achieved or reached. This is because of Na having a more reactive nature, with an ionization energy of 496 kJ/mol, compared to that of Mg, which has a higher ionization energy of 737 kJ/mol, given that the lower the ionization energy required, the easier it is to remove electrons, making it much easier for the element to react (Larsen, “Ionization Energy”).
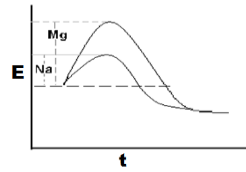
Figure 1. Reaction profiles of the Reaction with Mg and Na
How the concentration of the reactants affects the rate of reaction is shown by Tables 2.1 and 2.2. The slopes of the reaction rates with respect to the concentrations of the reactants of the setups can be found on Figures 2.1 and 2.2.
Table 2.1. Constant HCl Concentration
|
[Na2S2O3] |
[HCl] |
ln [Na2S2O3] |
Time (s) |
Rate (1/s) |
ln Rate |
|
0.15 M |
0.5 M |
-1.897 |
12 |
0.083 |
-2.485 |
|
0.12 M |
0.5 M |
-2.12 |
17 |
0.059 |
-2.833 |
|
0.09 M |
0.5 M |
-2.408 |
27 |
0.037 |
-3.296 |
|
0.06 M |
0.5 M |
-2.813 |
42 |
0.024 |
-3.738 |
|
0.03 M |
0.5 M |
-3.507 |
100 |
0.01 |
-4.605 |
Computations for the concentrations of HCl and Na2S2O3 are as follows:
[HCl] = = 0.5 M
[Na2S2O3]1 =  = 0.15 M
[Na2S2O3]2 =  = 0.12 M
[Na2S2O3]3 =  = 0.09 M
[Na2S2O3]4 =  = 0.06 M
[Na2S2O3]5 =  = 0.03 M
Through linear regression:
r = 0.998
mNa2S2O3 = 1.298
y-intercept = -0.083
Where,
y = ln Rate, x = ln [Na2S2O3]
mNa2S2O3 = the order of the reaction with respect to Na2S2O3
y-intercept = ln k + mHCl × ln [HCl]
Based on the gathered data from the experiment, the reaction is in first order with respect to Na2S2O3.
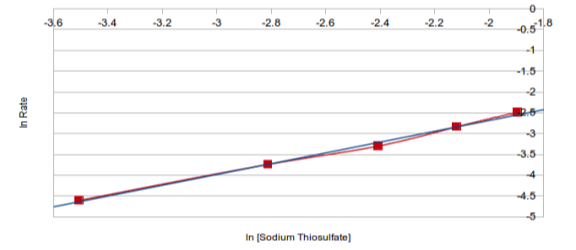
Figure 2.1. ln Rate vs. ln [Na2S2O3]
Table 2.2. Constant Na2S2O3 Concentration
|
[Na2S2O3] |
[HCl] |
ln [HCl] |
Time (s) |
Rate (1/Time) |
ln Rate |
|
0.1 M |
3 M |
1.099 |
5 |
0.2 |
-1.609 |
|
0.1 M |
2.4 M |
0.875 |
14 |
0.071 |
-2.639 |
|
0.1 M |
1.8 M |
0.588 |
14 |
0.071 |
-2.639 |
|
0.1 M |
1.2 M |
0.182 |
17 |
0.059 |
-2.833 |
|
0.1 M |
0.6 M |
-0.511 |
20 |
0.05 |
-2.996 |
Computations for the concentrations of HCl and Na2S2O3 are as follows:
[Na2S2O3] = = 0.1 M
[HCl]1 =  = 3.0 M
[HCl]2 =  = 2.4 M
[HCl]3 =  = 1.8 M
[HCl]4 =  = 1.2 M
[HCl]5 =  = 0.6 M
Through linear regression:
r = 0.771
mHCl = 0.659
y-intercept = -2.838
Where,
y = ln Rate, x = ln [HCl]
mHCl = the order of the reaction with respect to HCl
y-intercept = ln k + mNa2S2O3 × ln [Na2S2O3]
Based on the gathered data from the experiment, the given reaction is in zeroth order with respect to HCl.
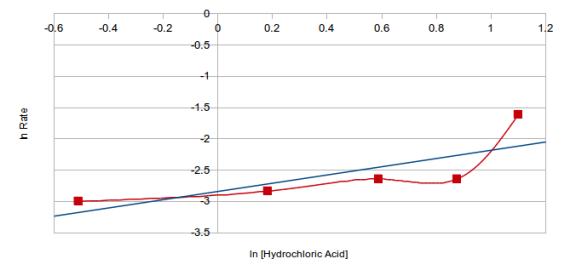
Figure 2.2. ln Rate vs. ln [HCl]
With a first overall reaction order, the rate law expression of the given reaction is:
Rate = k [Na2S2O3]1 [HCl]0
= k [Na2S2O3]
Moreover, the specific rate constant is:
Based on the data gathered with a constant [HCl]
y-intercept = ln k + mHCl × ln [HCl]
-0.083 = ln k + 0.659 (-0.693)
ln k = 0.374
k = 1.453 s-1
Based on the data gathered with a constant [Na2S2O3]
y-intercept = ln k + mNa2S2O3 × ln [Na2S2O3]
-2.838 = ln k + 1.298 (-2.303)
ln k = 0.151
k = 1.163 s-1
As seen in the rate law stated earlier, each reactant has an order which relates to how their concentration affect the rate of the reaction. That is, an increase in the concentration of the reacting particles also increases the reaction rate. As stated in the Collision Theory, all reactions happen as a result of collisions of the molecules of the reactants (Engle & Ilao, 2007). It only makes sense that an increase in concentration of reactants means that the number of collisions among reacting particles would also increase. This could only prove that the rate of a reaction is directly proportional to the number of collisions.
The effects of temperature to the rate of a reaction is shown by Table 3. The slope of the specific rate constant with respect to the temperature can be seen on Figure 3.
Table 3. Temperature as a Factor Affecting Reaction Rates
|
Temperature (℃) |
1/Temperature (1/K) |
Time |
Rate (1/s) |
k (s-1) |
ln k |
|
23.3 |
3.373 x 10⁻³ |
50 s |
0.02 |
0.385 |
-0.955 |
|
31.5 |
3.282 x 10⁻³ |
34 s |
0.029 |
0.558 |
-0.583 |
|
52.5 |
3.071 x 10⁻³ |
21 s |
0.048 |
0.916 |
-0.088 |
Calculations for the concentrations of HCl and Na2S2O3, and the specific rate constant are as follows:
[Na2S2O3] = = 0.052 M
[HCl]i =  = 0.041 M
Rate = k [Na2S2O3]
k = 
ki =  = 0.385 s-1
k2 =  = 0.558 s-1
k3 =  = 0.923 s-1
Through linear regression:
r = -0.99
ml = -2,778.572
y-intercept = 8.466
Where,
y = ln k, x = 1/Temperature
m = 
y-intercept = ln A
Hence,
m =
Ea = -mR
Ea = -(-2,778.572 K)(8.314 J/K mol)(1 kJ/1000 J)
Ea = 23.101
y-intercept = ln A
8.466 = ln A
A = 4,751.091 s-1
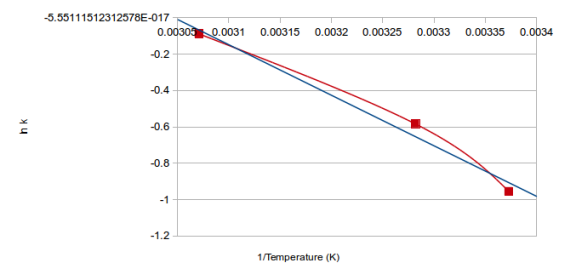
Figure 3. ln k vs. 1/Temperature
It is proven by the results that the setup with the greatest temperature had the fastest reaction compared to the other two with lower temperatures. The relationship between temperature and the rate of a reaction can be explained by the Arrhenius equation:
k = Ae-Ea/RT
The Arrhenius equation exhibits the relationship of temperature to the specific rate constant of a reaction. That is, as T increases, the negative exponent decreases making the value of k larger, leading to an increase to the reaction rate. This is because of the presence high energy particles at higher temperatures. The greater fraction of excited particles, the easier it is to satisfy the energy of activation, which is a requirement for the reaction to take place (“The Arrhenius Equation”).
Varying the amount of surface area of the reactant resulted into the visible observations that is shown by Table 4. A greater surface area means that there are more of the reactants’ surface exposed to one another. Simply put, there are more areas to react on. There is a greater chance for the reacting molecules to collide and interact. A smaller surface area, however, provides less area for reaction to occur. Some reacting molecules are shielded by other reacting molecules, making it harder to produce a reaction, resulting into a lower rate.
Table 4. Observations on Surface Area of the Reactant
|
Reactants |
Visible Results |
|
Strips of Mg ribbon |
Dissolution was relatively slower (reaction occurred in 26 seconds); Heat was formed; Evolution of gas was present |
|
Pieces of Mg ribbon |
Dissolution was fast (reaction occurred in 12.62 seconds); Heat was formed; Evolution of gas was also present |
The presence of a catalyst in the reaction resulted into the visible observations that is shown by Table 5. Catalysts are substances that alter the rate of reactions. A catalyst may speed up (a positive catalyst) or slow down (a negative catalyst) the reaction rate. In the given reaction in the experiment, CoCl2 acted as a positive homogeneous catalyst, which made the reaction rate occur faster and follow a different reaction mechanism with lower activation energies.
Table 5. Observations upon Addition of a Catalyst
|
Reactants |
Visible Results |
|
H2O2 + Rochelle Salt |
Colorless to murky; Relatively slow reaction (occurred in 30 seconds) |
|
H2O2 + Rochelle Salt + CoCl2 |
Purple to green, then turned pink again; Fast reaction (occurred in 23 seconds) |
CONCLUSION
In conclusion, many factors can affect the rate of a chemical reaction. The nature of the reactants affect the reaction rate based on the different activation energies of substances. The concentration of the reactants can also influence the frequency of collisions between the reacting molecules, which may affect the rate of reactions. Temperature not only affects the frequency of reactant collisions, but also affects the energy those collisions possess. The surface area of reactions influence the amount of available or exposed sites to react on. Lastly, the presence and nature of a catalyst not only alters the activation energy of the reaction, but also alters the mechanism in which the reactants react.
REFERENCES
Chang, R. (2010). Chemistry (10th ed.). New york, NY: McGraw-Hill.
Engle, H. L., & Ilao, L. V. (2015). Learning modules in general chemistry 2 (2007 ed). Manila, Philippines: Chemistry Unit, Department of Physical Sciences and Mathematics, College of Arts and Sciences, University of the Philippines Manila.
Larsen, D. (Ed.). (n.d.). Ionization Energy. Retrieved June 22, 2015, from http://chemwiki.ucdavis.edu/Physical_Chemistry/Physical_Properties_of_Matter/Atomic_and_Molecular_Properties/Ionization_Energy
The Arrhenius Equation. (1996). Retrieved June 22, 2015, from http://www.shodor.org/unchem/advanced/kin/arrhenius.html
University of the Philippines Manila, Chemistry unit. (2015). Laboratory manual in general chemistry 2 (2007 ed.). Manila, Philippines: Author.
CHEM 18.1, Factors Affecting Reaction Rates 1
Cite This Work
To export a reference to this article please select a referencing stye below:
Related Services
View all


DMCA / Removal Request
If you are the original writer of this essay and no longer wish to have your work published on UKEssays.com then please click the following link to email our support team:
Request essay removal